How To Use SGP To Rank and Value Players During the Season – Part 2 – Download and Prepare Rest of Season Projections

Welcome to the second part in a series of posts in which I’ll go through the process of plugging Steamer’s Rest of Season (RoS) projections into your existing ranking/dollar value spreadsheet so you can make informed and objective roster decisions during the season.

If you register as an SFBB Insider (it’s free), you can receive the entire series in an easy-to-use e-book (also free) along with two other helpful guides. I’ve also written a comprehensive guide on ranking players and calculating player dollar values that’s available at Amazon.

Introduction

In the second part of the series we will download the free Rest of Season Steamer projections that are available from Fangraphs.com.

Step-by-Step Instructions

Step Description
1. Visit Fangraphs’ Steamer RoS projections at this link or visit Fangraphs.com and hover over the “Projections” link on the menu bar and look for “Steamer (RoS)”.Fangraphs2
2. Once the page loads, use the link to “Export Data”.Fangraphs-RoS-Export
3. The data will download in CSV (comma separated value) format. Locate the downloaded CSV file and open it.

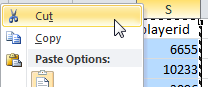
It should open in Microsoft Excel (if it doesn’t, launch Excel and then use the File>Open menu to open the CSV file).

You might recall from our earlier work that theFangraphs reports come withPlayerID as the last column in the file. We must move thisto be the first column so we can later use the VLOOKUP formula to pull data from theseRoS projections.Once the file opens, locate the “playerid” column. Right-click on the column header (column “W” in the image below) and choose to Cut the column.Cut_Fangraphs_ID

4. Now right-click on the first column header and choose the option to “Insert Cut Cells”.Insert_Fangraphs_ID
5. Repeat the steps above for pitchers. You can obtain RoS Steamer pitcher projections here or by clicking the “Pitchers” button at the top of the Steamer hitters web page.Steamer_RoS_Pitchers

The “playerID” column is currently column “S” in the Steamer RoS download.Excel-ROS-Projection-Part2-6

6. You have finished reordering the information and have copied it so it can be pasted into your rankings and dollar value calculation spreadsheet.

Example Excel File

We did not edit the main dollar value calculation spreadsheet in this part, so no example spreadsheet is provided.

Questions?

Do you have questions about Part 2? Or want to see what others have asked? Comment below.

How To Use SGP To Rank and Value Players During the Season – Part 1 – Introduction to Rest of Season Projections

Welcome to the first part in a series of posts in which I’ll go through the process of plugging Steamer’s Rest of Season (RoS) projections into your existing ranking/dollar value spreadsheet so you can make informed and objective roster decisions during the season.

A few notes about the series:

Let’s Get Started

If you’re a frequent reader of this site, hopefully you spent the offseason toiling over a spreadsheet making projections, developing rankings, and calculating dollar values.

That dynamite spreadsheet you created has probably been sitting on the shelf for the last month accumulating dust.  But did you know you can still use it to make informed in-season roster decisions?

I’ll show you how in a second.

Avoid This Scenario

Once the season starts, we immediately become retrospective in our decision making. You navigate out to the free agent listing and you see the stats players have accumulated to date.  Some utility infielder with a .240 career average is sitting there staring at you with 5 HR and a .386 batting average to start the season.

This is bad.  We don’t draft based on last season’s stats, so why should we make current roster decisions about last week’s stats?

As we do during the draft, we should be making roster decisions based on projected or future performances.

Some sites do offer full season projections.  They are helpful, but they become less meaningful as the season progresses.  Full season projections are likely not being updated, and we don’t care about the stats that someone has already earned.

What we really want are rest of season projections.  Or what a player is going to do from here on out.

How To Obtain Rest Of Season (RoS) Projections

Continue reading “How To Use SGP To Rank and Value Players During the Season – Part 1 – Introduction to Rest of Season Projections”

Improved SGP Calculation Formula – Part III

Welcome to the final of a three-part series in which we take a closer look at an improved method of determining standings gain points factors.  In the first part of the series we looked at the difference between my old method of calculating standings gain points factors and the improved approach suggested by Art McGee in his book, How to Value Players for Rotisserie Baseball.  In the second part of the series we looked at how to implement the SLOPE function in Microsoft Excel.

In this final part of the series we take a closer look at how these SGP changes affect the end rankings.

Old Vs. New

As I alluded to in part two, I’ve been tracking the standings history (link to view Excel file) for my favorite league for several years and I use this history to calculate my SGP factors.  Here’s a summary of the factors calculated under my old approach stacked up against the factors as calculated by the SLOPE function suggested by Art McGee in How to Value Players for Rotisserie Baseball.

Stat Old Approach SLOPE Approach % Change
BA 0.00184 0.00169 -8.15%
HR 9.63059 8.87013 -7.90%
R 24.82973 22.02314 -11.30%
RBI 25.05772 22.30803 -10.97%
SB 10.00577 8.18620 -18.19%
ERA -0.10587 -0.08817 -16.72%
K 35.14141 31.6227 -10.01%
SV 6.41558 5.69641 -11.21%
W 3.34776 2.95793 -11.64%
WHIP -0.01788 -0.01518 -15.10%

Continue reading “Improved SGP Calculation Formula – Part III”

Improved SGP Calculation Formula – Part II

Welcome to Part II of a three-part series in which I’ll share an improved method of determining standings gain points factors.  In the first part of the series we looked at the difference between my old method of calculating standings gain points factors and the improved approach suggested by Art McGee in his book, How to Value Players for Rotisserie Baseball.  

In this part of the series I’ll explain how to implement the SLOPE function McGee suggests.

The SLOPE Function

The SLOPE function interprets a set of data points and returns the slope of the linear line-of-best-fit for the data. The function requires two inputs:

  1. The Y-values of all the data points
  2. The X-values of all the data points

Again, we’re back in high school math class (or earlier?).  The Y-values (vertical axis) will be the actual accumulated statistics for each team in the league for the category we’re measuring.

The X-values (horizontal axis) will be the rotisserie points earned for each team.

For example:

Rotisserie Points (x-values) Home Runs (y-values)
12 291
11 287
10 281
9 274
8 272
7 267
6 263
5 261
4 244
3 239
2 234
1 191

Let’s Put This Into Excel

You can see the data entered into Excel below.

Given this exact set of data, the formula used in Excel to calculate the slope is:

=SLOPE(B2:B13,A2:A13)

A More Comprehensive Example

This is only the home run data for one season for one league.  In order to calculate more accurate SGP factors we should be including multiple years and/or leagues and we also need to perform these calculations for many different statistics (not just home runs).

A more thorough example Excel file that contains several years of data and the SLOPE calculations for the different years can be found below.  It’s not my prettiest work, but this is a file you only need to be in once a year, when you’re updating your SGP calculations for an upcoming season.  You can download the file using the ExcelWebApp toolbar below the spreadsheet.

WHAT’S COMING?

In the final part of the series I’ll take a deep dive into how these changes in SGP calculations affect our end rankings.

Want More In-Depth Analysis Like This?


Thanks For Reading

Stay smart.


Improved SGP Calculation Formula – Part I

Welcome to Part I of a three-part series in which I’ll share an improved method of determining standings gain points factors.  In this first part I’ll show graphically demonstrate the old method I used in calculating SGP factors and compare it to the improved method.

I’m mostly self-taught when it comes to my knowledge of standings gain points.  It’s hard to say where I picked up the information.  I think it’s an accumulation of information gleaned from message boards and old web sites.  Nevertheless, I continue to learn and I recently came across an improved method of calculating SGP factors.

Enter Art McGee

Art McGee published his approach to using standings gain points in his book, How to Value Players for Rotisserie Baseball.  The book was originally published in 1997 and he put out an updated version in 2007.  So his theories have been around for quite some time and continue to live on.  The Excel implementation of SGPs that I use has been tweaked some, but is very consistent with McGee’s approach.

NOTE:  I have provided an affiliate link (what’s an affiliate link?) to the book on Amazon to the right, but at the time of writing, I don’t suggest you buy it from Amazon.  It seems like the book is difficult to come by and the prices are quite high.  The link is just so you can see the book and read the summary, or maybe the prices will come down in the future.  If you do want to purchase McGee’s book, Baseball HQ is selling them on a close out sale for $8.95 plus S&H.  That’s where I got my copy.

A Difference Is Found

Not too far into McGee’s explanation did I come across an important difference in the way he calculates his SGP factors.  To illustrate the difference, let’s take a look the following sets of Home Run standings:

Rotisserie Points HR Data Set #1 HR Data Set #2
12 291 300
11 287 273
10 281 260
9 274 249
8 272 249
7 267 248
6 263 243
5 261 241
4 244 231
3 239 231
2 234 229
1 191 203

I previously would have calculated my SGP factor for “HR Data Set #1” as the first place value (291) less the last place value (191), divided by the number of teams that could be passed (in a 12-team league you pass 11 teams by going from worst to first).  Specifically the SGP for Data Set #1 is 9.0909 ((291-191)/11) and for Data Set #2 is 8.8182 ((300-203)/11).

Let’s Plot It Out

The red line below plots out the approach I have been using to calculate my SGP factors.  If you think back to high school math class, we’re really calculating the slope of the line here.  Notice how the 9.0909 I calculated above matches the slope in the formula representing the red line, y = 9.0909x + 181.91.

And when you look at the red line next to the other plotted data points, you see that it doesn’t do a great job of fitting data as a whole.  This is the weakness in only using the highest and lowest data points to approximate the number of home runs necessary to move up one point in the standings.

Home_Run_Standings_Gain_Points Continue reading “Improved SGP Calculation Formula – Part I”

How Do I Calculate SGP For OPS?

We’ve now calculated SGP for three rate statistics:  batting average, on-base percentage, and slugging percentage.  So let’s go for the ultimate challenge and combine two ratio statistics together!

This is the most complicated calculation yet, because of the fact that we have two rate stats being combined together.  And to make matters more complicated, in this scenario, we don’t know the breakdown of OPS into OBP and SLG.  Despite that, I think we can calculate the SGP factors accurately.

Let’s take a look at how to perform an SGP calculation for on-base plus slugging (OPS).

A Warning About This Data

What follows is a step-by-step calculation for determining OPS SGP in an NL-only league.  I do not have standings data for a mixed-league using OPS as a category.

If you play in a mixed league, use these exact SGP factors at your own risk.  They’ll give you an approximation, but the OPS standings in a mixed league will surely be different than in an NL-only league.

The good news is that if you have standings history for your own OPS league, you can follow this exact methodology to calculate the SGP factors for your league.

The Standings Data

Thanks to reader Bob who filled out the “What It Takes To Win Your League Calculator” with six years of data from this NL-only league:

SGP_OPS_Standings

The decline in OPS over this time frame was eye-catching to me.  So much so, that I think we’d be doing ourselves a disservice to include all six years of data.  And the decline happens at all spots in the standings (1st place and 10th place).  It’s roughly a 40 to 60 point drop from 2008 to 2013 regardless of the position in the standings you look at.  The numbers from just 2011 to 2013 look much more consistent.

With this in mind, I decided to trim things down to only include the last three years of data.  This is worth keeping in mind for all statistical categories.  I’m sure HR are down in all formats too.  So including ten years of history in your HR calculations may not be appropriate.

Here are only the last three years:

SGP_OPS_Standings2

How Many OPS Percentage Points Move You Up One Spot In The Standings?

Over the last three years, an average of .774 won the category and an average of .720 finished 10th.

.774 – .720 = .054 total spread between 10 teams

We have the data for 10 teams, meaning there are 9 spots you can move up in the standings by moving from .720 to .774 in team OPS.

.054 / 9 = .006

On average, increasing your team OPS by .006 points (in this NL-only league) will result in you climbing one spot in the standings.

What Formula Do I Use To Calculate The SGP For a Given Player?

Continue reading “How Do I Calculate SGP For OPS?”

You Need To Read This If You Play In a Two-Catcher League

In this post I’m going to demonstrate why you can’t simply rely upon the rankings information you find online.  Widely available rankings do not account for the intricacies of your league.  These differences can lead to large swings in the valuations of players.

You should be calculating your own rankings specific to your own league format, especially if you play in a two-catcher league.  There is a valuation problem waiting to be exploited in two-catcher leagues.  

Please make sure you read to the end.  I get a little carried away with examples below, but there are some important conclusions at the end.

This Is Not a Lie

When I run Steamer’s 2014 projections through my ranking system, Buster Posey and Wilin Rosario come out as top 10 players.

Let that sink in.  In all the draft preparation and rankings articles you’ve read so far, have you seen any catcher crack the top ten?

You’re a Moron.  Your Ranking System Must Be Wrong.

Before you dismiss this out of hand, let’s work through a little exercise.  As with most scenarios I outline at this site, let’s assume a 12-team mixed league using standard 5×5 rotisserie categories, 14 hitters (2 C, 1B, 2B, SS, 3B, CI, MI, 5 OF, UTIL), 9 pitchers, and no bench. This would mean 24 catchers would be drafted, 60 OF, and 168 total hitters.

So as not to pick on any one analyst, I’ll be referring to the consensus fantasy baseball hitter rankings that FantasyPros.com puts out (if you don’t use this tool, it’s pretty neat.  You can instantly average the rankings of your favorite analysts).

As of March 10th, Buster Posey comes in as the top catcher and 36th ranked hitter.  Matt Holliday comes in as the 35th ranked hitter.

Matt_Holliday_Buster_Posey

Let’s say Team A drafts Holliday and with the very next pick, Team B drafts Posey.

If a ranking system were really accurate, you would think the combined stats from Holliday (the 35th ranked player) and Team A’s final draft pick should be very similar to the combined stats of Posey (the 36th ranked player) and Team B’s final draft pick.

Let’s Take a Look

Because Team A passed on Posey, let’s assume they decide to wait until the last round of the draft to fill their second catcher slot by taking the 24th ranked catcher.  In those same consensus rankings, the 24th catcher is Welington Castillo.

Wellington_Castillo

And because Team B wasn’t able to take Holliday with their pick, they decide to wait until the last round to draft their fifth outfielder.  When the time comes, Team B selects the 60th ranked OF (12 teams * five OF per team).  The consensus rankings tell us Kole Calhoun is that guy.

Kole_Calhoun

So Team A ends up with Holliday and Castillo.  Team B ends up with Posey and Calhoun. Applying Steamer’s 2014 projections to these two teams we get:

Player AB H AVG HR R RBI SB
Holliday 530 152 .287 22 78 81 4
Castillo 365 92 .252 12 41 45 2
Total Team A 895 244 .273 34 119 126 6
Player AB H AVG HR R RBI SB
Posey 557 165 .296 20 78 84 2
Calhoun 529 141 .267 17 72 69 11
Total Team B 1,086 306 .282 37 150 153 13

Wow.

Team B wins every category.  The reason for this is the concept of the replacement level players.  The 60th (last picked) OF is still pretty productive, whereas the last catcher selected is a problem.

Maybe Posey should be ranked higher if he gives you that big of an advantage.

You Cherry Picked This Example.  No Way Does This Work Out Like This Every Time.

It is very possible Calhoun is also slanting the results.  When I run his Steamer projection through my ranking system he comes out as the 41st OF (so the consensus rankings are underrating him by ranking him the 60th OF).  I think he’s a terrific sleeper.  So let’s drop twenty three more spots down to Gerardo Parra.

Why Parra, you ask?  Well, he does come out as the 60th best OF when I run the 2014 Steamer projections through my ranking calculations.  He’s ranked the #83 OF in the FantasyPros consensus ranks.

Gerardo_Parra

It would seem that dropping 23 spots further should affect things significantly.  But let’s take a look:

Player AB H AVG HR R RBI SB
Holliday 530 152 .287 22 78 81 4
Castillo 365 92 .252 12 41 45 2
Total Team A 895 244 .273 34 119 126 6

Continue reading “You Need To Read This If You Play In a Two-Catcher League”

Locating Historic League Standings Information in Yahoo

One of the keys to using the Standings Gain Points method to valuing fantasy baseball players is having historic league standings from which to calculate your SGP factors.

I’ve learned that locating historic standings in Yahoo! can be difficult if you don’t use the option to continue your league and roll it forward from year-to-year.

If you do roll your leagues forward, you can easily access past years from the “Season” drop down menu on the league home page.

Yahoo_Baseball_Seasons

If you don’t see this option or want to access the standings from past seasons, check out these instructions below:

How To Access Old Yahoo League Standings

Step Procedures
1. Visit the league page for any current year Yahoo league.
2. Click on the “My Team” link on the main header of your league page.Yahoo_Fantasy_Baseball
3. Once on your team page, you will see your team name in larger font. Right below this team name you will see a hyperlink, in smaller font, to your Yahoo! fantasy sports profile.  Click this link (for example, see the “SFBB” link in the image below).Yahoo_User_Profile
4. Your Yahoo! fantasy sports profile lists information about your past performances, has a trophy case, and lists out each fantasy sports league you’ve played at Yahoo.Yahoo_Trophy_Case
5. It appears like Yahoo keeps your fantasy baseball league standings available indefinitely.  I can get back to final standings from leagues as far back as the early 2000’s.Yahoo_Fantasy
6. To access the standings for a specific league, click on the link for the league name.Yahoo_League
7. You’ll then see the summarized league standings.  To see the more detailed category totals and category standings, click on the “Full Standings” link in the header bar.Yahoo_Rotisserie
8. Wow, I had a good pitching staff that season.  The team-by-team point totals are presented at the top of the page.Yahoo_Final_Standings
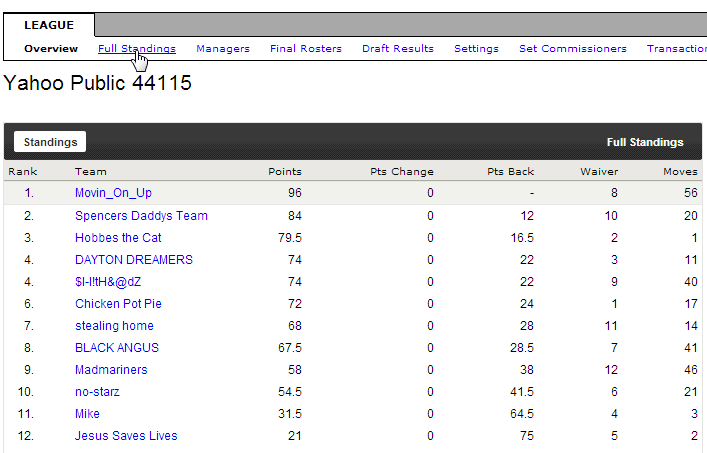
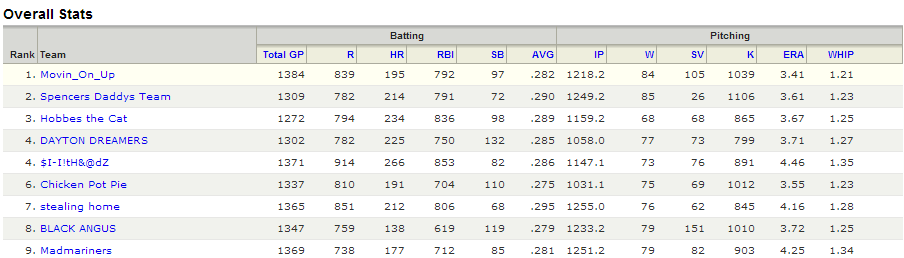
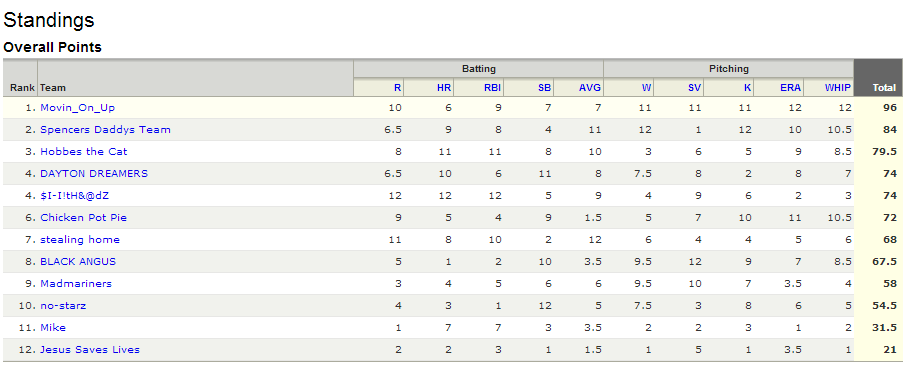
And the accumulated team stat totals are at the bottom.

Yahoo_Team_Stats

9. These are the figures you can enter into the “What It Takes To Win Your League” calculator to get a summarized look at the stats it has taken over time to win your specific league and to calculate SGP factors from.What-It-Takes-To-Win-Your-League

I’m Looking For Historic League Data

If you have used the “What It Takes To Win Your League” calculator and would be willing to provide me with the information, I’m looking to accumulate this data.  I’m mostly interested in non-standard league sizes and/or leagues that use non-standard statistics like OBP, OPS, K/9, Holds, Quality Starts, etc.

If you have this information available and are interested in helping out, please use the “Contact Me” page of this site to get in touch with me.

Thanks For Reading

Make smart choices.

2014 Rankings and Dollar Values Download Now Available

As draft day quickly approaches, I realize that not everyone will have the opportunity to work through the rankings and dollar value generation process from start to finish.  In order to accommodate people in this situation, the "Using Standings Gain Points to Rank and Value Fantasy Baseball Players" guide will now include an Excel download with the full ranking and dollar value process applied.

The Excel file includes the free Steamer projections available at Fangraphs.com.  The file is fully editable, but will come ranked according to a 12-team mixed league, traditional rotisserie categories and lineups (14 hitters, 9 pitchers).  You can use the guide to tailor this Excel file for your specific league settings and lineup configuration (the biggest adjustment you need to make is to determine the replacement level factors for each position).

Please click here to read more or to get your own copy of the this step-by-step guide for ranking players and calculating dollar values (and inflation!).

smartfantassybb_3d-500x635Or use the buttons below if you'd like to purchase the guide now for $9.99.

Buy Now View Cart

How To Calculate Auction Dollar Values and Account For Inflation

smartfantassybb_3d-500x635I’m very happy to announce that I’ve just finished the “missing pieces” to the “Create Your Own Fantasy Baseball Rankings” guide.

Parts 1 – 6, that walk you through the process of developing a league-specific ranking for each hitter and pitcher, will continue to be freely available here.

A fully comprehensive guide that includes calculating dollar values and incorporates calculations for keeper and in-draft inflation is available here.

This guide now goes up to 10 Parts:

  • Part 1 – Download Free Projection Data
  • Part 2 – Understanding Player IDs
  • Part 3 – VLOOKUP, Excel Tables, Named Ranges
  • Part 4 – Pitcher Rankings
  • Part 5 – Understanding Standings Gain Points
  • Part 6 – Accounting for Replacement Level and Position Scarcity
  • Part 7 – Understanding The Hitter/Pitcher Dollar Allocation
  • Part 8 – Converting SGPs into Hitter Dollar Values
  • Part 9 – Converting SGPs into Pitcher Dollar Values
  • Part 10 – Incorporating In-Draft Price Inflation and Keeper League Inflation

I’m very proud of this guide and believe it to be the best step-by-step guide to ranking players and calculating dollar values available anywhere.

Please click here to read all about the additions to the guide and how to purchase your copy.

Thanks For Reading

Good luck, as we approach draft season!  Stay smart.