Tools for the 2025 Season – Available Now!!!

The SFBB Excel tools are updated and ready to help you prepare for the 2025 season! If you’re looking to build skills and develop your own methods for ranking and valuing players, these are for you!

Title Description
Automated SGP Ranking Excel Tool – $17.99
***UPDATED for 2025***

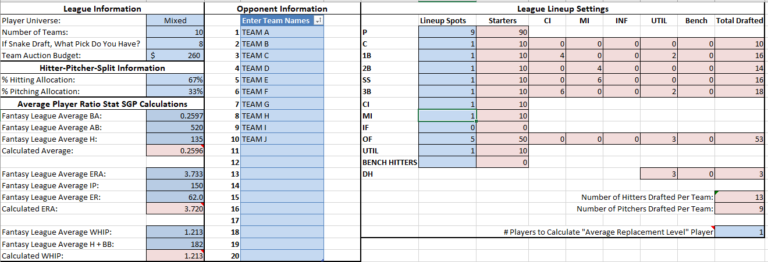
The Automated SGP Ranking Tool will help you convert your favorite projection set (Steamer, The Bat, Razzball, RotoWire, PECOTA, etc.) into Excel-based rankings and dollar values tailored to your own league’s settings. The process takes only minutes. No messy Excel formulas. Just load your projections into the file, adjust a few settings, and standings gain points rankings are calculated automatically. Click here to read more about the tool.


Automated Points League Ranking Excel Tool – $17.99
***UPDATED for 2025***

Powered by the same concepts as the Automated SGP Ranking Tool, the Automated Points League Ranking Tool does all the same things, just for nearly any imaginable points league. The tool works with any popular projection set and allows you to enter your league’s unique point scoring system, then instantly converts those projections into tailored point totals and dollar values. The process take minutes and will give a huge advantage over owners that are not tailoring rankings specifically to the league scoring system. Click here to read more about the points league tool.


AGGREGATOR Projection Aggregator – $9.99
***UPDATED for 2025***

An easy-to-use Excel spreadsheet that can combine (or average) up to five different projection sets. The aggregator can use just about any well-known projection set you can find on the web (if you find one that doesn’t work, let me know!). Simply download your favorite projection sets, fill out some settings, and you’re done. No complicated formulas or VLOOKUPS for you to add.


The Process – 2025 Edition
***UPDATED for 2025***

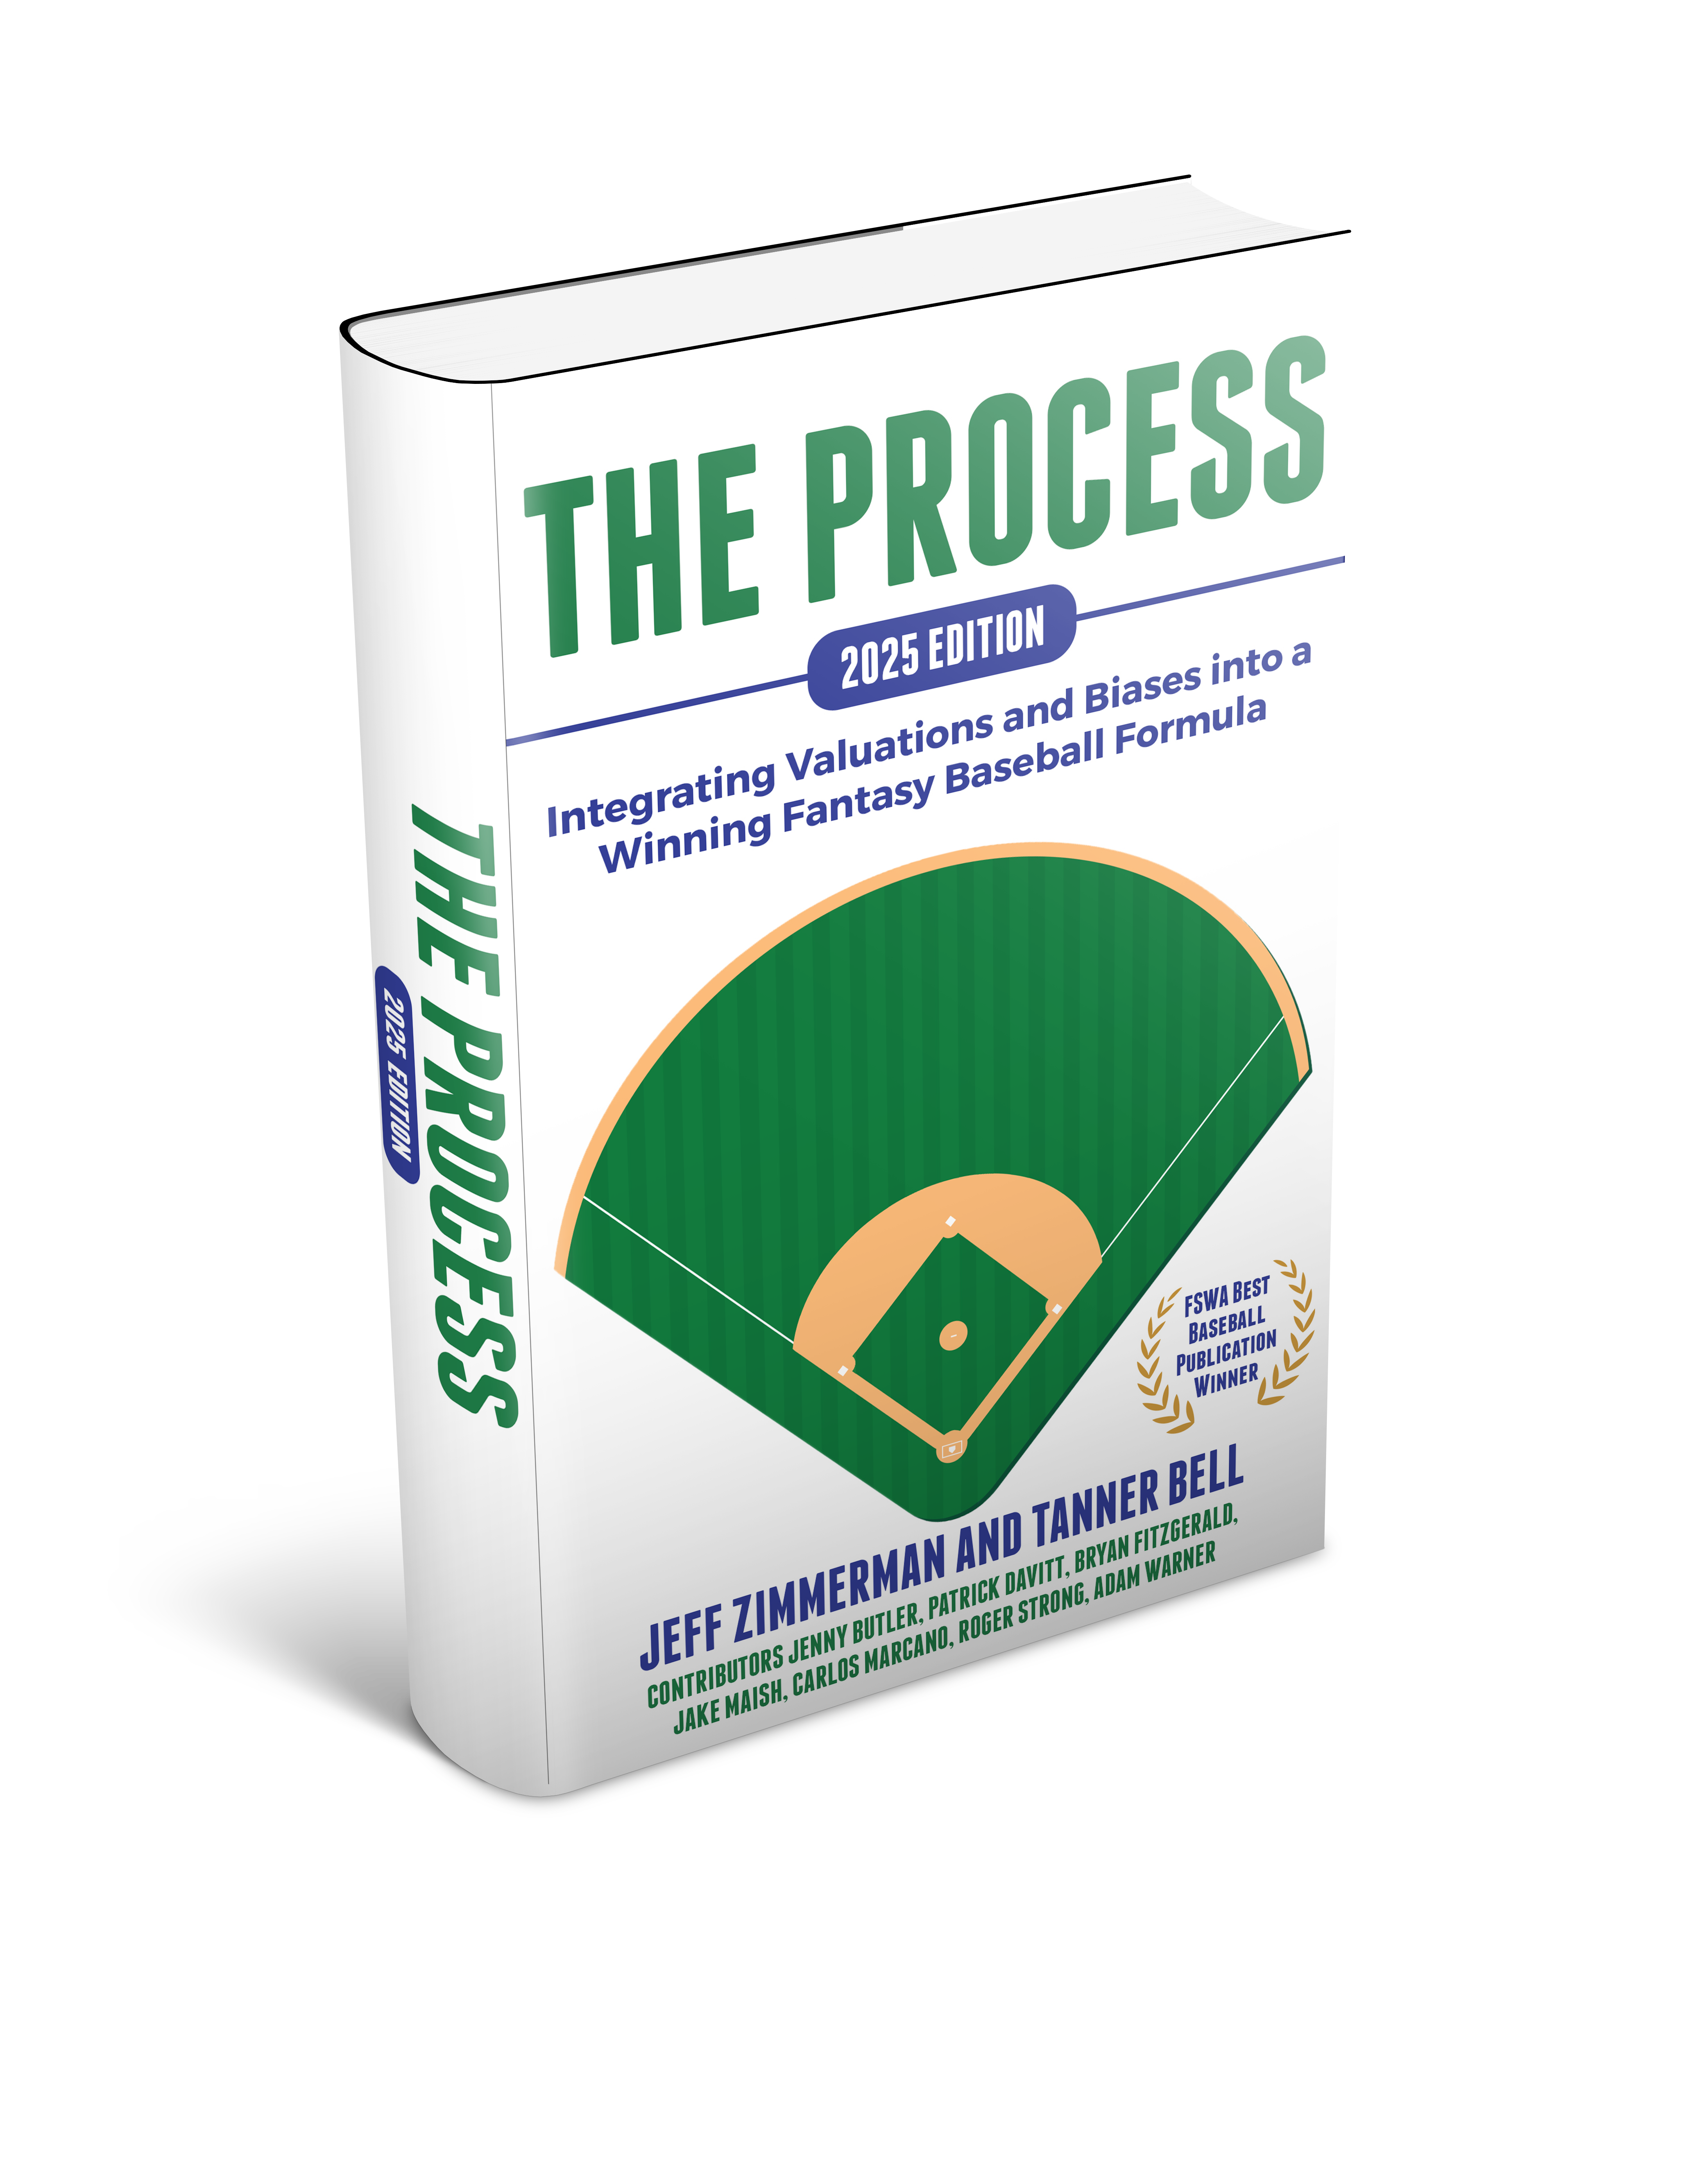
This year’s edition of The Process contains many exciting new updates, studies, standings, and SGP data. Visit thefantasybaseballprocess.com to read many more details.

Appendix 2025 Edition (PDF) – $14.99

Click here to purchase the Appendix 2025 Edition in a PDF e-book format for $14.99.

Full 2025 Edition (PDF) – $19.99

Click here to purchase the Full 2025 Edition in a PDF e-book format for $19.99.


Appendix 2025 Edition (Paperback) – $17.99

The appendix is also available in paperback form on Amazon.com. Click here to purchase the appendix on Amazon for $17.99.

Full 2025 Edition (Paperback) – $24.99

The full book is also available in paperback form on Amazon.com. Click here to purchase the book on Amazon for $24.99.

Tools for the 2024 Season – Available Now!!!

The SFBB Excel tools are updated and ready to help you prepare for the 2024 season! If you’re looking to build skills and develop your own methods for ranking and valuing players, these are for you!


Title Description
Automated SGP Ranking Excel Tool – $17.99
***UPDATED for 2024***

The Automated SGP Ranking Tool will help you convert your favorite projection set (Steamer, The Bat, Razzball, RotoWire, PECOTA, etc.) into Excel-based rankings and dollar values tailored to your own league’s settings. The process takes only minutes. No messy Excel formulas. Just load your projections into the file, adjust a few settings, and standings gain points rankings are calculated automatically. Click here to read more about the tool.


Automated Points League Ranking Excel Tool – $17.99
***UPDATED for 2024***

Powered by the same concepts as the Automated SGP Ranking Tool, the Automated Points League Ranking Tool does all the same things, just for nearly any imaginable points league. The tool works with any popular projection set and allows you to enter your league’s unique point scoring system, then instantly converts those projections into tailored point totals and dollar values. The process take minutes and will give a huge advantage over owners that are not tailoring rankings specifically to the league scoring system. Click here to read more about the points league tool.


AGGREGATOR Projection Aggregator – $9.99
***UPDATED for 2024***

An easy-to-use Excel spreadsheet that can combine (or average) up to five different projection sets. The aggregator can use just about any well-known projection set you can find on the web (if you find one that doesn’t work, let me know!). Simply download your favorite projection sets, fill out some settings, and you’re done. No complicated formulas or VLOOKUPS for you to add.


Tools for the 2023 Season – Available Now!!!

The SFBB Excel tools are updated and ready to help you prepare for the 2023 season! If you’re looking to build skills and develop your own methods for ranking and valuing players, these are for you!

Title Description
Automated SGP Ranking Excel Tool – $17.99
***UPDATED for 2023***

The Automated SGP Ranking Tool will help you convert your favorite projection set (Steamer, The Bat, Razzball, RotoWire, PECOTA, etc.) into Excel-based rankings and dollar values tailored to your own league’s settings. The process takes only minutes. No messy Excel formulas. Just load your projections into the file, adjust a few settings, and standings gain points rankings are calculated automatically. Click here to read more about the tool.


Automated Points League Ranking Excel Tool – $17.99
***UPDATED for 2023***

Powered by the same concepts as the Automated SGP Ranking Tool, the Automated Points League Ranking Tool does all the same things, just for nearly any imaginable points league. The tool works with any popular projection set and allows you to enter your league’s unique point scoring system, then instantly converts those projections into tailored point totals and dollar values. The process take minutes and will give a huge advantage over owners that are not tailoring rankings specifically to the league scoring system. Click here to read more about the points league tool.


AGGREGATOR Projection Aggregator – $9.99
***UPDATED for 2023***

An easy-to-use Excel spreadsheet that can combine (or average) up to five different projection sets. The aggregator can use just about any well-known projection set you can find on the web (if you find one that doesn’t work, let me know!). Simply download your favorite projection sets, fill out some settings, and you’re done. No complicated formulas or VLOOKUPS for you to add.


The Process – 2023 Edition
***UPDATED for 2023***

This year’s edition of The Process contains many exciting new updates, studies, standings, and SGP data. Visit thefantasybaseballprocess.com to read many more details.

Full 2023 Edition (PDF) – $17.99

Click here to purchase the Full 2023 Edition in a PDF e-book format for $17.99.


Full 2023 Edition (Paperback) – $22.99

The book is also available in paperback form on Amazon.com. Click here to purchase the book on Amazon for $22.99.

Tools for the 2022 Season – Available Now!!!

The SFBB Excel tools are updated and ready to help you prepare for the 2022 season! If you’re looking to build skills and develop your own methods for ranking and valuing players, these are for you!

Title Description
Automated SGP Ranking Excel Tool – $17.99
***UPDATED for 2022***

The Automated SGP Ranking Tool will help you convert your favorite projection set (Steamer, The Bat, Razzball, RotoWire, PECOTA, etc.) into Excel-based rankings and dollar values tailored to your own league’s settings. The process takes only minutes. No messy Excel formulas. Just load your projections into the file, adjust a few settings, and standings gain points rankings are calculated automatically. Click here to read more about the tool.


Automated Points League Ranking Excel Tool – $17.99
***UPDATED for 2022***

Powered by the same concepts as the Automated SGP Ranking Tool, the Automated Points League Ranking Tool does all the same things, just for nearly any imaginable points league. The tool works with any popular projection set and allows you to enter your league’s unique point scoring system, then instantly converts those projections into tailored point totals and dollar values. The process take minutes and will give a huge advantage over owners that are not tailoring rankings specifically to the league scoring system. Click here to read more about the points league tool.


AGGREGATOR Projection Aggregator – $9.99
***UPDATED for 2022***

An easy-to-use Excel spreadsheet that can combine (or average) up to five different projection sets. The aggregator can use just about any well-known projection set you can find on the web (if you find one that doesn’t work, let me know!). Simply download your favorite projection sets, fill out some settings, and you’re done. No complicated formulas or VLOOKUPS for you to add.


Everything You Need to Know About the Player ID Map

Contents

This post is intended to be an all-encompassing discussion of the Player ID Map tool. Click the links below to jump directly to a specific section below. Use the Back browser or mouse button to jump back to this list.

What Is the Player ID Map?

The MLB and fantasy baseball landscapes are wide reaching. We fantasy players gather information, projections, and opinions from many locations. Any time you have a situation like this, where data is coming from many disparate places, some form of “mapping” table can help connect the dots and data points from these different sources.

If you’ve ever tried to line projections from Fangraphs up with projections from Baseball Prospectus, Mastersball, or Baseball HQ, you’ll understand this challenge. You may have tried a VLOOKUP in Excel or Google Sheets to line the data up side-by-side. But player names are not a great mechanism to do this. Names can change (see Nick Castellanos and Nicholas Castellanos or B.J. Upton and Melvin Upton). Name conventions can differ between sites (see A.J. Pollock and AJ Pollock or Ronald Acuna and Ronald Acuna Jr.). Even worse, there are occasionally duplicate names (Chris Young being a recent example).

The Player ID Map solves these discrepancies. It enables an owner to line up an A.J. Pollock in their spreadsheet to an AJ Pollock from projection system. The Player ID Map is the bridge that has enabled me to build tools like the Projection Aggregator and the Automated SGP Ranking Tool. It enables building spreadsheet tools and other solutions that can work with or link to major sports websites (ESPN), projection systems (Steamer, Razzball, Mastersball, ATC), and fantasy baseball providers (NFBC, Fantrax, Yahoo!, Draftkings).

What Versions of This Tool are Available?

All the different “versions” below are pointing to the same source information. They are just different formats of using or viewing the data.

  1. Excel Version (LINK) – A downloadable Excel file that can be incorporated into your own fantasy baseball spreadsheets. The data in this file contains connections to the main version I maintain in an online Google Sheet. This version will likely be out of date when it is downloaded, but instructions on how to refresh the data through the connection to the Google sheet are easy-to-follow and are included later in this post. The Excel version contains two tabs:
    • PLAYERIDMAP – All available IDs and naming system information that I track
    • Change Log – Explanations of changes made, including additions, corrections, and dates these changes were made
  2. Web Version of PLAYERIDMAP (LINK) – A live look at the html/web-based version of the PLAYERIDMAP tab in the live Google Sheet. You might use this if you just want to see the Player ID Map or look for specific pieces of information
  3. CSV Version of PLAYERIDMAP (LINK) – A one-time CSV download of the Player ID Map tab of the live Google Sheet. I wouldn’t really recommend using this because there is no connection back to the live data I maintain, like in the Excel version. But it could be used if you only need an easy-to-use one-time dump of the data.
  4. Web Version of Change Log (LINK) – A live look at the html/web-based version of the Change Log tab in the live Google Sheet. This could be used to review recent changes to the central Sheet and determine if a refresh is needed.
  5. CSV Version of the Change Log (LINK) – I have no idea why I make this available. Seems like it wouldn’t be valuable at all! But it’s here if you need it. It’s a one-time CSV download of just the Change Log tab.

How Do I Update or Refresh the Player ID Map?

Note, you will be prompted about the potential danger of downloading Excel files from the internet the first time you download and open the Player ID Map. There are no dangerous macros or harmful code embedded in the file. It does maintain a connection back to my Google source file to enable you to download updated information. Click “Enable Editing” to accept this reminder and be able to interact with the Excel file.

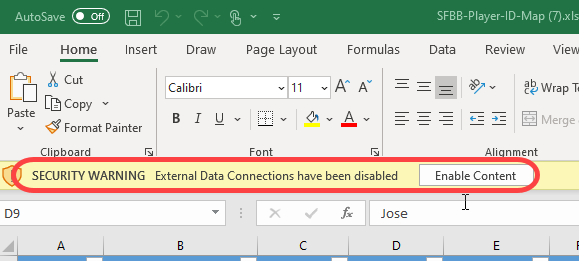
You may at times also see an Excel warning that external data connections can be harmful. These are common warning messages and good reminders that you do have to be careful what you download on the web. Click “Enable Content” to allow the data connection to pull in refreshed player ID data.
If you trust me and do download the Excel file, here’s how to refresh it.

Step Description
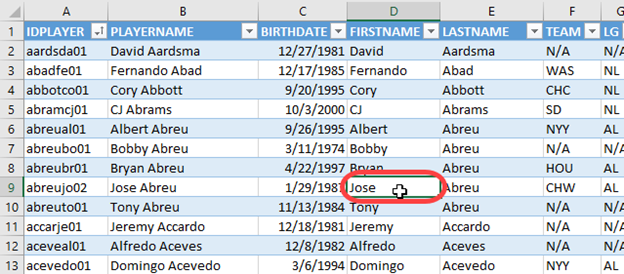
1. Select a cell inside of the player ID data. It does not matter which player or piece of data. It just has to be something inside the blue and white table.
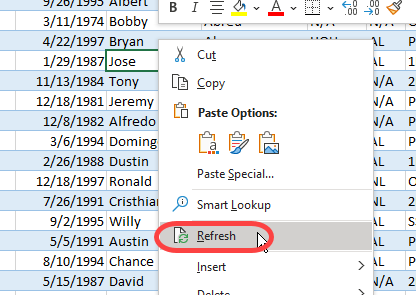
2. Right-click on the selected cell and choose the menu option to “Refresh”.
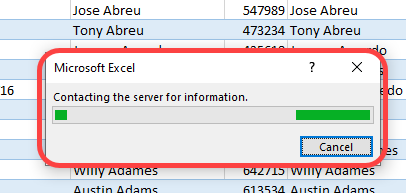
3. You will begin to see various status messages as Excel begins to refresh the connection. You may see information being relayed in the bottom right of Excel.

A popup may appear. And status information may even appear in the bottom left of Excel (I couldn’t grab a screenshot quick enough).

The entire refresh may take 60 seconds or so. And it may depend on how much time has transpired since your last update. You don’t really get a “This is Done!!!” message. You’ll just know you’re ready to proceed when all the statuses stop changing.

Origin

I created the Player ID Map in 2013. I started my ID map largely from information from Tim Blaker’s map. Tim continues to provide updates in his mapping file, but our maps have different purposes. I needed the flexibility to add new names and systems and not be reliant upon someone else. But I continue to use Tim’s map as an input to mine when I’m performing major updates for new players that enter the baseball world.

The Player ID Map has grown since 2013. I continue to add new systems, new name formats, and even new information about each player that will help me provide spreadsheet tools the the SFBB audience.

Do People Really Use This Thing?

I’m surprised at how often it’s used. At the time I write this article, the file has been downloaded or refreshed over 280,000 times (Who knows. 200,000+ of them could be me tinkering in spreadsheets). If I could only figure out a way to charge ten cents each time it’s used…

It’s an integral part to building long-lasting and flexible fantasy baseball spreadsheets that can take advantage of many different sources of baseball data.

Does the Player ID Map Include All MLB Players?

No. The tool is intended to be used for fantasy baseball purposes. Accordingly, the goal is to include only “fantasy relevant” players. That’s a purposely vague threshold. In the preseason, I generally keep the top 750ish players accordingly to NFBC ADP included in the Player ID Map. This should be enough players to cover most normal leagues. It’s possible the Player ID Map will not be deep enough for your 20-team NL-only league, your AL Central-only league, or your middle-reliever contest. Keep reading for advice on how to get more players added to the Player ID Map.

Continue reading “Everything You Need to Know About the Player ID Map”
Tools for the 2021 Season – Available Now!!!

Looking to get a jump on the 2021 season? Here are the Excel tools and books that are updated and ready to help you prepare for the upcoming season. If you’re looking to build skills and develop your own methods for ranking and valuing players, these are for you! All of the spreadsheet tools listed below have been updated for the 2021 season.

Title Description
The Process The Process – 2021 Edition
***UPDATED for 2021***

We are sorry to announce that there will not be major updates to The Process for the 2021 edition. Among other things, the shutdown and restarting of the season, the rule changes, the odd schedules, and the seven-inning games would have us questioning the validity of any innovative research.

With that in mind, we’ve decided to offer two editions this year, so our readers can choose the version that’s right for them.

2021 Appendix Edition (PDF) – $7.99

This is the edition for owners that have previously read the 2020 edition and are now looking for updated 2021 appendix data. This slimmed-down version contains just the 65-page appendix containing SGP analysis, Steamer projections, standings data for 2018-2020, and Jeff and Tanner’s thoughts on how to use the standings data from the 2020 season. Click here to purchase the Appendix Only 2021 Edition in a PDF e-book format for $7.99.


Full 2021 Edition (PDF) – $17.99

If you have not previously bought the book, this is the edition for you. The body of this book is the same as the 2020 edition, with an updated appendix. The appendix is updated for various leagues’ standings gains points (SGP), 2021 Steamer projections with the SGP, projected handedness splits, and others. Click here to purchase the Full 2021 Edition in a PDF e-book format for $17.99.


Full 2021 Edition (Paperback) – $22.99

Click here to order the paperback edition on Amazon.

Automated SGP Ranking Excel Tool – $17.99
***UPDATED for 2021***

The Automated SGP Ranking Tool will help you convert your favorite projection set (Steamer, The Bat, Razzball, RotoWire, PECOTA, etc.) into Excel-based rankings and dollar values tailored to your own league’s settings. The process takes only minutes. No messy Excel formulas. Just load your projections into the file, adjust a few settings, and standings gain points rankings are calculated automatically. Click here to read more about the tool.


Automated Points League Ranking Excel Tool – $17.99
***UPDATED for 2021***

Powered by the same concepts as the Automated SGP Ranking Tool, the Automated Points League Ranking Tool does all the same things, just for nearly any imaginable points league. The tool works with any popular projection set and allows you to enter your league’s unique point scoring system, then instantly converts those projections into tailored point totals and dollar values. The process take minutes and will give a huge advantage over owners that are not tailoring rankings specifically to the league scoring system. Click here to read more about the points league tool.


AGGREGATOR Projection Aggregator – $9.99
***UPDATED for 2021***

An easy-to-use Excel spreadsheet that can combine (or average) up to three different projection sets. The aggregator can use just about any well-known projection set you can find on the web (if you find one that doesn’t work, let me know!). Simply download your favorite projection sets, fill out some settings, and you’re done. No complicated formulas or VLOOKUPS for you to add.


Tools for the 2020 Season – Available Now!!!

Looking to get a jump on the 2020 season? Here are the Excel tools and books that are updated and ready to help you prepare for the upcoming season. If you’re looking to build skills and develop your own methods for ranking and valuing players, these are for you! All of the spreadsheet tools listed below have been updated for the 2020 season.

Title Description
The Process – 2020 Edition
***UPDATED for 2020***

Co-authored with Jeff Zimmerman, this is our comprehensive guide of the process we use to succeed during a fantasy baseball season. From preseason preparations, the draft, and all the stages of the season, it’s everything we know about playing this game. The book is available in a PDF e-book for $17.99 here or in paperback form at Amazon here.

You can read a comprehensive writeup of all that’s included in the book here, including the foreword by Clay Link, the full table of contents, and testimonials by fantasy analysts like Rob Silver, Rudy Gamble, Eno Sarris, Mike Podhorzer, and Mike Gianella.

Automated SGP Ranking Tool
***UPDATED for 2020***

The Automated SGP Ranking Tool will help you convert your favorite projection set (Steamer, The Bat, Razzball, RotoWire, PECOTA, etc.) into Excel-based rankings and dollar values tailored to your own league’s settings. The process takes only minutes. No messy Excel formulas. Just load your projections into the file, adjust a few settings, and standings gain points rankings are calculated automatically. Click here to read more about the tool.

Automated Points League Ranking Tool
***UPDATED for 2020***

Powered by the same concepts as the Automated SGP Ranking Tool, the Automated Points League Ranking Tool does all the same things, just for nearly any imaginable points league. The tool works with any popular projection set and allows you to enter your league’s unique point scoring system, then instantly converts those projections into tailored point totals and dollar values. The process take minutes and will give a huge advantage over owners that are not tailoring rankings specifically to the league scoring system. Click here to read more about the points league tool.

AGGREGATOR Projection Aggregator
***UPDATED for 2020***

An easy-to-use Excel spreadsheet that can combine (or average) up to three different projection sets. The aggregator can use just about any well-known projection set you can find on the web (if you find one that doesn’t work, let me know!). Simply download your favorite projection sets, fill out some settings, and you’re done. No complicated formulas or VLOOKUPS for you to add.

Using Standings Gain Points to Rank and Value Fantasy Baseball Players

Ever wanted to create your own rotisserie rankings? This is my instructional guide written specifically to show you how to create customized rotisserie player rankings, dollar values, and inflation dollar values, in Microsoft Excel, tailored to your own league. No more downloading rankings from the web, hoping they apply to your unique league. 10, 12, or 15-team league? $260 or $300 budget? AL-only or mixed league? 10 hitters or 14? It doesn’t matter. This book will guide you through the process of developing rankings for just about any kind of rotisserie league.

How to Rank and Value Fantasy Baseball Players for Points Leagues

My step-by-step guide to building custom rankings, dollar values, and inflation dollar values, in Microsoft Excel, for your points league. This book will guide you through the process of developing rankings for just about any point-based scoring format.

New Excel Tool – Automated SGP Rankings and Dollar Values

I’m a firm believer that using customized projections and running those through a valuation system, like standings gain points, is the single biggest leap a fantasy owner can take in improving at fantasy baseball. The problem with taking that step is it’s a significant hurdle to get over.

It’s complicated. It takes learning advanced Excel skills. It’s time consuming. It’s not for everyone.

I’ve been hard at work to help solve these problems. It’s taken several years, but I’m finally able to announce the new Automated SGP Rankings Excel Tool. With this Excel tool, you’ll be able to calculate rankings and dollar values from your favorite projection set within minutes. You can use Steamer, any other Fangraphs projection set, Rotowire, Mastersball, and even PECOTA. Whatever projection set you have access to should work.

You can have tailored rankings and dollar values within minutes using the Automated SGP Rankings Tool.

Interested in learning more about this tool? Watch the following video or click here to read all about its features.

The Automated SGP Rankings Excel Tool is now available for the 2019 season! This tool will save you huge amounts of time. You won’t be stuck troubleshooting Excel formulas. You can focus on player research and forming your own opinions about players. You’ll have custom dollar values to make decisions from. Those values will be tailored to your league’s specific settings. It’s a great step toward winning your league this upcoming season.

The Excel tool currently works with the following rotisserie categories:

Hitting Categories Pitching Categories
Runs (R) Wins (W)
Home Runs (HR) Saves (SV)
Runs Batted In (RBI) Strikeouts (K)
Stolen Bases (SB) Earned Run Average (ERA)
Batting Average (BA) Walks + Hits per Inning Pitched (WHIP)
On Base Percentage (OBP) Quality Starts (QS)
Slugging Percentage (SLG) Holds (HD)
On Base Plus Slugging (OPS) Saves + Holds (SV+HD)

Click here to read more about its features and to purchase the tool.

More (Than You Wanted to Know) About Ratio Stats and Standings Gain Points

Most of the concepts used in the standings gain points process of valuing players are straightforward. If there’s one facet of the process that causes the most confusion, it’s the handling of ratio statistics like batting average and WHIP. In the piece that follows, I’ll revisit the basics of what makes ratios statistics different and then I’ll get into two very specific and more complicated questions I often see.

  1. How do you determine the baseline (or league average) ratio to compare the player pool to?
  2. What if you don’t use an accurate measure for that baseline?

Counting Stats are Simple

A player cannot hit a “negative home run” or “lose strikeouts”. Each counting stat helps you move closer to the next team in the standings. So when we are calculating SGP for a player, the counting stats all evaluate out to a positive number. For example, if we determine based on 2017 standings that it takes 8.526 home runs to move up one spot in the standings, Dee Gordon’s two home runs still calculate out to 0.2346 standings gain points. They’re still beneficial in an absolute sense.

Ratio Stats are Messy

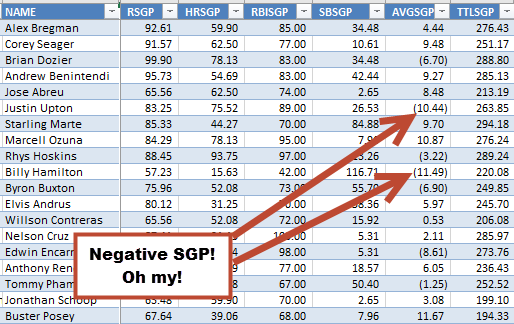
When it comes to rotisserie scoring of ratio stats, we are not judged in that same manner. A player with a poor batting average or a bad earned run average can lower your score within those categories. You can have negative ratios that cause you to lose points or fall in the standings. A player can have a negative SGP for a ratio category.

Negative-Standings-Gain-Points-SGP

How Do We Calculate SGP for Ratio Stats?

NOTE: This part is a refresher. If you already have a general understanding of how this works, skip down to the next bolded heading.

Let’s revisit how we calculate things for ratio stats. Directly from my guide “Using Standings Gain Points to Rank and Value Fantasy Baseball Players” (with specific text emphasized):

If we assume a league of 12 teams and 14 hitters on each team (adjust for your roster size), that is 168 players (12 * 14). In the Steamer projections, the top 168 major leaguers are projected for an average of about 509 at bats per player.

This means the average team in this fantasy league will have approximately 7,126 at bats (14 players * 509 at bats). According to Razzball, the average rotisserie batting average in 12-team leagues was .267. This means the average team had approximately 1,902 hits (7,126 * .267). And the average player had 136 hits (1,902 team hits / 14 players).

To find the impact of Trout we need to remove one “average” player from the team and then add in Trout’s projections. We can do the same for Tulowitzki.

13 “average” players * 509 at bats = 6,617

13 “average” players * 136 hits = 1,768

Before I start getting into the intricacies of that process, it’s important to understand that the approach we use to calculate SGP for ratio stats is to find an individual player’s effect on that ratio stat for an AVERAGE team in the standings.

Here’s a closer look at how you would do this for batting average:

Step Description
1. You first need to know what your fantasy league’s average batting average was. In this example, let’s say it’s .267.
2. Determine what the SGP factor is for the ratio stat. In this example, let’s use 0.0019 (the raw factor for the 12-team Online Championships calculated here).
3. You then need an approximation of how many at bats it took to generate that average. In this example, I determined that 168 players (12 teams * 14 players per team) would average 509 at bats. (more on how this was determined later!)
4. Using that information, derive the number of hits the average player had. Knowing the league average and the number of at bats, we can easily figure out that the average player would have had 136 hits (.267 * 509 = 135.9).
5. Next, you extrapolate the 136 hits and 509 at bats per player to team totals. But not a full team of players. ONE LESS PLAYER THAN A FULL TEAM (PER YOUR LEAGUE’S SETTINGS). We’re trying to figure out what an average team looks like without the one player we’re trying to rank.

In this example of a 14-player roster, we’ll use 13 players (one less than a full team). This means the average team (minus one player) would have 1,768 hits (13 * 136) and 6,617 at bats (13 * 509).

It’s CRITICAL that these two numbers hold true to your league average stat. Notice that 1,768 divided by 6,617 is still .267.

6. Then, you add in the projection for the player being evaluated and DETERMINE THE TEAM’S RATIO STAT WITH THAT PLAYER. Assume a player is projected for a .300 average on 200 hits and 667 at bats. The calculation would be:

= (1,768 hits + 200 hits) / (6,617 at bats + 667 at bats)

= 1,968 hits / 7,284 at bats

= .27018 AVG

7. Finally, determine the effect of the individual player by subtracting the average team’s ratio (from step 1 above) from the recalculated team ratio with the player, then divide by the SGP factor.

In our example, this calculation would be:

= (.27018 – .267) / 0.0019

= 1.6737 SGP

Instead of using a player with a .300 average, assume we used a player that dragged the team average down to .264. For this player, the SGP calculation would be:

= (.264 – .267) / 0.0019

= -1.5789 SGP

Negative standings gain points! I said this cannot happen with counting stats… But it CAN AND WILL HAPPEN with ratio stats.

How Do You Determine the Baseline (or League Average) Ratio to Compare the Player Pool to?

When you read through that description above, things generally make sense. But when you actually try to reperform that process, you’ll quickly realize I skipped some steps and take some liberties…

Continue reading “More (Than You Wanted to Know) About Ratio Stats and Standings Gain Points”

Tools for the 2018 Season – Now Available!

Here are the Excel tools and books I have available for the 2018 season. You won’t find draft lists or player profiles here. But if you’re looking to build skills and to develop your own methods for ranking and valuing players, these are for you! All of the spreadsheet tools listed below have been updated for the 2018 season.

Title Description
AGGREGATOR Projection Aggregator
***UPDATED for 2018***

An easy-to-use Excel spreadsheet that can combine (or average) up to three different projection sets. The aggregator can use just about any well-known projection set you can find on the web (if you find one that doesn’t work, let me know!). Simply download your favorite projection sets, fill out some settings, and you’re done. No complicated formulas or VLOOKUPS for you to add.

Using Standings Gain Points to Rank and Value Fantasy Baseball Players

Ever wanted to create your own rotisserie rankings? This is my instructional guide written specifically to show you how to create customized rotisserie player rankings, dollar values, and inflation dollar values, in Microsoft Excel, tailored to your own league. No more downloading rankings from the web, hoping they apply to your unique league. 10, 12, or 15-team league? $260 or $300 budget? AL-only or mixed league? 10 hitters or 14? It doesn’t matter. This book will guide you through the process of developing rankings for just about any kind of rotisserie league.

How to Rank and Value Fantasy Baseball Players for Points Leagues

My step-by-step guide to building custom rankings, dollar values, and inflation dollar values, in Microsoft Excel, for your points league. This book will guide you through the process of developing rankings for just about any point-based scoring format.