We’ve now calculated SGP for three rate statistics: batting average, on-base percentage, and slugging percentage. So let’s go for the ultimate challenge and combine two ratio statistics together!
This is the most complicated calculation yet, because of the fact that we have two rate stats being combined together. And to make matters more complicated, in this scenario, we don’t know the breakdown of OPS into OBP and SLG. Despite that, I think we can calculate the SGP factors accurately.
Let’s take a look at how to perform an SGP calculation for on-base plus slugging (OPS).
A Warning About This Data
What follows is a step-by-step calculation for determining OPS SGP in an NL-only league. I do not have standings data for a mixed-league using OPS as a category.
If you play in a mixed league, use these exact SGP factors at your own risk. They’ll give you an approximation, but the OPS standings in a mixed league will surely be different than in an NL-only league.
The good news is that if you have standings history for your own OPS league, you can follow this exact methodology to calculate the SGP factors for your league.
The Standings Data
Thanks to reader Bob who filled out the “What It Takes To Win Your League Calculator” with six years of data from this NL-only league:

The decline in OPS over this time frame was eye-catching to me. So much so, that I think we’d be doing ourselves a disservice to include all six years of data. And the decline happens at all spots in the standings (1st place and 10th place). It’s roughly a 40 to 60 point drop from 2008 to 2013 regardless of the position in the standings you look at. The numbers from just 2011 to 2013 look much more consistent.
With this in mind, I decided to trim things down to only include the last three years of data. This is worth keeping in mind for all statistical categories. I’m sure HR are down in all formats too. So including ten years of history in your HR calculations may not be appropriate.
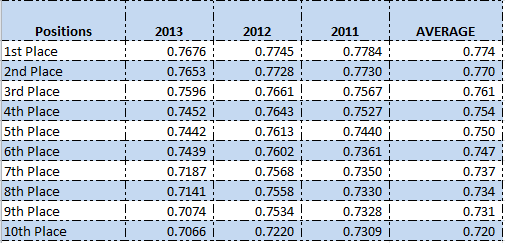
Here are only the last three years:

How Many OPS Percentage Points Move You Up One Spot In The Standings?
Over the last three years, an average of .774 won the category and an average of .720 finished 10th.
.774 – .720 = .054 total spread between 10 teams
We have the data for 10 teams, meaning there are 9 spots you can move up in the standings by moving from .720 to .774 in team OPS.
.054 / 9 = .006
On average, increasing your team OPS by .006 points (in this NL-only league) will result in you climbing one spot in the standings.