Hopefully More Than Just Another Draft Recap

The Great Fantasy Baseball Invitational
Click here to see a list of participants The Great Fantasy Baseball Invitational. I’m in League 13.

I recently participated in my The Great Fantasy Baseball Invitational (TGFBI) draft, which, if you’re a Twitter user and follow anyone in the fantasy baseball landscape, you could not have avoided. I do want to share with you some observations I had during the draft, but similar to my other writings, the goal here is to give some actionable advice (even if you’re reading this in the future) and not get too hung up on my team and specific players.

The Context

The invitational is made of 13 separate 15-team leagues. Each of these leagues will compete like any traditional rotisserie league and crown a champion within that league. The twist is that there is also an overall competition across the 13 leagues, whereby all 195 teams are competing in one massive rotisserie competition to crown an overall champion (similar to how the NFBC works). The one person that emerges atop 194 other experts can surely claim to be one of the best fantasy baseball players around.

This is the inaugural year of the competition, but it’s such an innovative idea that there’s no shortage of well-known folks competing. You can see the full list of participants here.

I’m participating in League #13. I happen to be the last name on the roster of the last league! What does that tell you, ha! You can see the draft results here. I was picking from the fifth spot.

My Feelings Going Into the Draft

While I’m obsessed with fantasy baseball, I really don’t view myself as anything special in this arena. Sure, I’ve MacGyver’ed up some neat spreadsheet tools over the years. But I don’t view my preparation process as anything special. I DON’T DO ANYTHING YOU’VE NEVER HEARD OF BEFORE. I’m not holding back any secret tricks of the trade.

And because I don’t do anything special, I was nervous as hell heading into this draft. I joked a few paragraphs back about being the last name on the last league. I don’t really know if that’s indicative of anything, but even if it is, I get it! I don’t even think I’ve written five legitimate articles in the past two years. It wouldn’t surprise me if that’s the lowest output of any participant involved. Meanwhile, many of the others are busting their backs to write articles and create podcasts on an aggressive and regular schedule.

These guys and gals are painstakingly combing over StatCast data, spin rates, hard hit rates, launch angles, swinging strike rates, and more… Meanwhile, I pretty much just let them do the work, read their articles, listen to their podcasts, plop some projections into a spreadsheet, make some manual adjustments, and I’m ready to rock with a comprehensive list of players and expected earnings dollar values.

Imagine my feelings when I’m now competing against some of the folks I admire the most in this business… Mike Gianella, Mike Podhorzer, Jeff Zimmerman, Rudy Gamble, and Rob Silver, to name a few.

Alright. Enough about me. Let’s try to make this useful. I apologize if some of what follows comes across as inflammatory or soap-boxy. Not everything can be sugar-coated. Here are my top lessons learned and observations after participating in this draft.

#1 – Exploit the League Rules

I really, really, really didn’t want to start with this one. It’s what EVERY SINGLE introduction to fantasy sports article ever written in the history of the world has started with.

So you would have expected that every one of the 195 participants would have done this, right?

But guess what??? I’m speculating, but I’d bet less than half of the TGFBI participants gave the rules a worthwhile look (I do realize saying “the TGFBI” is probably redundant, but it looks too weird not to do it). They probably assumed we were playing by prototypical standard rules and just checked to determine if we were using batting average or on-base percentage. But there are two rules we are playing by that are not exactly “standard” and each was something that I think needed to be known going into the draft. These two rules should have affected your behavior in the draft, and possibly in a significant way. Those two rules are:

  • Starting rosters include only one catcher but two utility spots
  • Rosters allow for five reserves and up to five DL spots for injured players
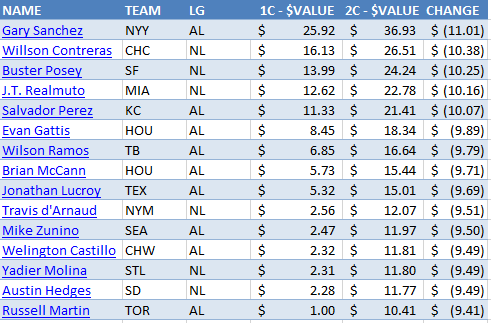
Pretty simple stuff, but small differences in rules, like starting one catcher instead of two, can have a significant effect on player valuation.

Why does this matter? In a 15-team league, I show the effect of going from two starting catchers to one as having around a $10 swing in value! That is an ENORMOUS detail (Note: the values in the image reflect the change from 2 C & 1 UTIL to 1 C & 2 UTIL, not just the move to 1 C).

The fact that this change is so significant surprises some people. But these are the same objective calculations that tell me Mike Trout, Trea Turner, Jose Altuve, Chris Sale, Clayton Kershaw, and Max Scherzer should be the highest valued players for the 2018 season. This isn’t speculation or “feel” about how to adjust for position scarcity. If you want to read more about the reason for this, here’s an illustrated example I put together from a few years ago.

As some of the faster drafting leagues started to get into the second and third rounds, we saw the big name catchers start to go. Then word quickly spread over Twitter, “This is a one-catcher league.” The effect quickly kicked in and the catchers starting plummeting. I’m a little disappointed this had to spread like a juicy rumor. I’d have expected everyone to know this going in.

I also suspect that many folks were worried the rules allowed for five reserve spots and no recourse for injured players. I believe this is how NFBC leagues and Fantrax leagues that allow for transactions operate (e.g. NFBC Main Event). I don’t have hard evidence to support this claim, but it just seemed like injured players like Michael Brantley, Michael Conforto, Jimmy Nelson, and Alex Reyes were going later than they should have been. My guess is they’d have been pushed up draft boards aggressively had everyone known this.

Small tip here. I don’t mind pushing up these injured players when you have a realistic way of replacing them that won’t burden you (force you to keep dead weight on your roster). Not only do you secure a talented player at a discount, you get the added benefit of being able to take chances on the waiver wire early in the season, when the odds are higher that you’ll be able to find a hidden gem.

My takeaway here is to not take anything in the rules for granted. Comb over them. Think about what the wrinkles in the rules might allow or incentivize you to do. Tailor your rankings and calculate your dollar values with these rules in mind. And don’t assume your enemies are doing the same. This can be an edge.

#2 – Use Dollar Values Tailored to Those League Rules to Make Decisions

My stance on this is simple and straightforward. If you’re not drafting with a set of projection-based dollar values in mind, you can do better.

I don’t care if you calculate them yourself, if you use the Fangraphs auction value calculator or the Rotowire custom dollar values, or if you buy a piece of software that does it for you… You’re not optimizing your chances of winning if you’re not drafting from values. You need a framework for comparing two hitters to each other, for comparing a hitter to a pitcher, and for making educated decisions. This is what dollar values do! Without dollar values, you’re being subjective. You’re letting biases creep into your decision making.

Do I have evidence that this approach works? The folks at Friends With Fantasy Benefits (specifically @smada_bb) undertook the incredible task of tracking and logging all 13 drafts into a Google Sheet with projected standings and it seems to support what I’m saying.

I don’t know exactly how every analyst drafts, but based on following folks on Twitter, reading certain sites, and discussions I’ve had with people, I’m pretty certain these folks all do value-based drafting:

Continue reading “Hopefully More Than Just Another Draft Recap”
More (Than You Wanted to Know) About Ratio Stats and Standings Gain Points

Most of the concepts used in the standings gain points process of valuing players are straightforward. If there’s one facet of the process that causes the most confusion, it’s the handling of ratio statistics like batting average and WHIP. In the piece that follows, I’ll revisit the basics of what makes ratios statistics different and then I’ll get into two very specific and more complicated questions I often see.

  1. How do you determine the baseline (or league average) ratio to compare the player pool to?
  2. What if you don’t use an accurate measure for that baseline?

Counting Stats are Simple

A player cannot hit a “negative home run” or “lose strikeouts”. Each counting stat helps you move closer to the next team in the standings. So when we are calculating SGP for a player, the counting stats all evaluate out to a positive number. For example, if we determine based on 2017 standings that it takes 8.526 home runs to move up one spot in the standings, Dee Gordon’s two home runs still calculate out to 0.2346 standings gain points. They’re still beneficial in an absolute sense.

Ratio Stats are Messy

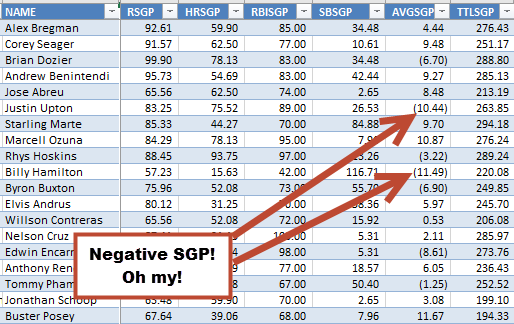
When it comes to rotisserie scoring of ratio stats, we are not judged in that same manner. A player with a poor batting average or a bad earned run average can lower your score within those categories. You can have negative ratios that cause you to lose points or fall in the standings. A player can have a negative SGP for a ratio category.

Negative-Standings-Gain-Points-SGP

How Do We Calculate SGP for Ratio Stats?

NOTE: This part is a refresher. If you already have a general understanding of how this works, skip down to the next bolded heading.

Let’s revisit how we calculate things for ratio stats. Directly from my guide “Using Standings Gain Points to Rank and Value Fantasy Baseball Players” (with specific text emphasized):

If we assume a league of 12 teams and 14 hitters on each team (adjust for your roster size), that is 168 players (12 * 14). In the Steamer projections, the top 168 major leaguers are projected for an average of about 509 at bats per player.

This means the average team in this fantasy league will have approximately 7,126 at bats (14 players * 509 at bats). According to Razzball, the average rotisserie batting average in 12-team leagues was .267. This means the average team had approximately 1,902 hits (7,126 * .267). And the average player had 136 hits (1,902 team hits / 14 players).

To find the impact of Trout we need to remove one “average” player from the team and then add in Trout’s projections. We can do the same for Tulowitzki.

13 “average” players * 509 at bats = 6,617

13 “average” players * 136 hits = 1,768

Before I start getting into the intricacies of that process, it’s important to understand that the approach we use to calculate SGP for ratio stats is to find an individual player’s effect on that ratio stat for an AVERAGE team in the standings.

Here’s a closer look at how you would do this for batting average:

Step Description
1. You first need to know what your fantasy league’s average batting average was. In this example, let’s say it’s .267.
2. Determine what the SGP factor is for the ratio stat. In this example, let’s use 0.0019 (the raw factor for the 12-team Online Championships calculated here).
3. You then need an approximation of how many at bats it took to generate that average. In this example, I determined that 168 players (12 teams * 14 players per team) would average 509 at bats. (more on how this was determined later!)
4. Using that information, derive the number of hits the average player had. Knowing the league average and the number of at bats, we can easily figure out that the average player would have had 136 hits (.267 * 509 = 135.9).
5. Next, you extrapolate the 136 hits and 509 at bats per player to team totals. But not a full team of players. ONE LESS PLAYER THAN A FULL TEAM (PER YOUR LEAGUE’S SETTINGS). We’re trying to figure out what an average team looks like without the one player we’re trying to rank.

In this example of a 14-player roster, we’ll use 13 players (one less than a full team). This means the average team (minus one player) would have 1,768 hits (13 * 136) and 6,617 at bats (13 * 509).

It’s CRITICAL that these two numbers hold true to your league average stat. Notice that 1,768 divided by 6,617 is still .267.

6. Then, you add in the projection for the player being evaluated and DETERMINE THE TEAM’S RATIO STAT WITH THAT PLAYER. Assume a player is projected for a .300 average on 200 hits and 667 at bats. The calculation would be:

= (1,768 hits + 200 hits) / (6,617 at bats + 667 at bats)

= 1,968 hits / 7,284 at bats

= .27018 AVG

7. Finally, determine the effect of the individual player by subtracting the average team’s ratio (from step 1 above) from the recalculated team ratio with the player, then divide by the SGP factor.

In our example, this calculation would be:

= (.27018 – .267) / 0.0019

= 1.6737 SGP

Instead of using a player with a .300 average, assume we used a player that dragged the team average down to .264. For this player, the SGP calculation would be:

= (.264 – .267) / 0.0019

= -1.5789 SGP

Negative standings gain points! I said this cannot happen with counting stats… But it CAN AND WILL HAPPEN with ratio stats.

How Do You Determine the Baseline (or League Average) Ratio to Compare the Player Pool to?

When you read through that description above, things generally make sense. But when you actually try to reperform that process, you’ll quickly realize I skipped some steps and take some liberties…

Continue reading “More (Than You Wanted to Know) About Ratio Stats and Standings Gain Points”

2017 Average Standings and SGP for the 2018 Season

In order to prepare for the upcoming season, we need some important information from last year. In this post, I’ll share with you the average standings for 12- and 15-team NFBC leagues, and the average ERA, WHIP, and batting average in those leagues. With this information, you should have everything you need to get started on your SGP rankings for the 2018 season.

Where Do I Get This Data From?

The last several years, I’ve participated in the NFBC’s Draft Champions competition. By participating in such a league, a user gets access to see the standings to all the various NFBC competitions.

As far as I can tell, it seems like you need to be a registered NFBC user to see the standings data. If you happen to be one (and you’re logged into the NFBC site), you can see standings data for the various contests at these links:

I take this data and manipulate it in Excel to calculate average standings across all the leagues using the process I describe here.

If you are not an NFBC user, you can see some of the historic analysis I’ve compiled from 2012 through 2016 here.

With that in mind, let’s take a look at the 2017 results.

12-team League Average Standings

Across the 149 Online Championship leagues hosted by NFBC, the average standings for first through twelfth are shown below. Note, the 1,156 RBI is the average of all teams that finished in first place in RBI. It is NOT the average of what league winners averaged in the RBI category. The league winner in RBI could have finished in 7th place overall, but is included in the 1,156 average figure.

RK PTS AVG R HR RBI SB ERA WHIP W K SV
1 12 .2788 1,178 365 1,156 174 3.480 1.171 107 1,522 105
2 11 .2750 1,144 349 1,121 159 3.638 1.204 102 1,469 97
3 10 .2727 1,125 340 1,098 149 3.740 1.222 98 1,435 90
4 9 .2706 1,108 332 1,080 142 3.827 1.238 96 1,403 85
5 8 .2688 1,091 324 1,061 135 3.891 1.250 93 1,372 81
6 7 .2674 1,078 317 1,045 129 3.960 1.263 90 1,341 76
7 6 .2660 1,064 310 1,027 123 4.027 1.276 88 1,313 70
8 5 .2643 1,048 303 1,011 117 4.100 1.287 85 1,282 65
9 4 .2626 1,029 296 992 111 4.171 1.300 82 1,245 59
10 3 .2609 1,010 288 972 105 4.263 1.316 78 1,209 51
11 2 .2588 983 277 948 96 4.375 1.336 73 1,150 40
12 1 .2543 937 258 896 80 4.557 1.366 66 1,057 26

12-team League SGP Factors

Using the information from the league average standings, the raw and relative SGP factors are as follows:

SGP TYPE AVG R HR RBI SB ERA WHIP W K SV
Raw 0.0019 19.060 8.526 20.635 7.405 (0.086) (0.0160) 3.288 37.244 6.461
Relative 0.00009 0.924 0.413 1.000 0.359 (0.0023) (0.0004) 0.0883 1.000 0.174

Historic Online Championship (12-team League) SGP Factors

Here are the Online Championship hitting categories:

Year Type BA R HR RBI SB
2012 Raw 0.00220 19.197 8.016 20.675 8.270
2013 Raw 0.00193 19.265 7.537 20.685 8.603
2014 Raw 0.00197 18.843 7.481 19.639 7.900
2015 Raw 0.00177 19.920 8.429 19.549 7.591
2016 Raw 0.00182 19.721 8.797 21.527 8.508
2017 Raw 0.00193 19.060 8.526 20.635 7.405
2012 Relative 0.00011 0.92848 0.38769 1.000 0.40001
2013 Relative 0.00009 0.93136 0.36435 1.000 0.41589
2014 Relative 0.00010 0.95950 0.38094 1.000 0.40224
2015 Relative 0.00009 1.01898 0.43115 1.000 0.38828
2016 Relative 0.00008 0.91607 0.40863 1.000 0.39520
2017 Relative 0.00009 0.92366 0.41320 1.000 0.35885

Here are the Online Championship pitching categories:

Year Type ERA WHIP W K SV
2012 Raw (0.07840) (0.01320) 3.253 30.968 7.184
2013 Raw (0.07623) (0.01472) 2.899 32.811 7.038
2014 Raw (0.06880) (0.01280) 2.999 31.181 6.964
2015 Raw (0.07876) (0.01464) 2.926 35.163 7.210
2016 Raw (0.08042) (0.01529) 3.184 34.212 6.842
2017 Raw (0.08587) (0.01548) 3.288 37.244 6.461
2012 Relative (0.00253) (0.00043) 0.10503 1.000 0.23197
2013 Relative (0.00232) (0.00045) 0.08837 1.000 0.21452
2014 Relative (0.00214) (0.00040) 0.09320 1.000 0.21640
2015 Relative (0.00224) (0.00042) 0.08321 1.000 0.20505
2016 Relative (0.00235) (0.00045) 0.09307 1.000 0.19998
2017 Relative (0.00231) (0.00042) 0.08827 1.000 0.17348

15-team League Average Standings

The NFBC offers two different types of 15-team leagues. The “Main Event” is a closer approximation to your typical home league, in that it allows for in season player pickups from the waiver wire. The Draft Championship does NOT allow in-season moves, but you do draft a 50-player team in order to build a deeper roster that might get you through the season without the ability to add anyone.

Continue reading “2017 Average Standings and SGP for the 2018 Season”

Analyzing AL- and NL-Only Standings Data

As much as I love the standings gain point approach to valuing players, it does have an a couple of inherent weaknesses.

First, it’s dependent upon some form of league history to work. The whole ranking and valuation process is derived from previous standings data! Those starting new leagues, or joining an existing league, don’t have this information available.

Second, assuming you have prior standings to draw from, I’ve always been bothered by the small sample sizes of that data. And I don’t know about you, but something odd always seems to happen in my leagues. One year someone runs away with it, one year it’s a tight race between five teams, one year we add two teams, the next year we contract a team.

What are we to do?!?!

Thank You OnRoto and NFBC

Thankfully, some very generous league hosting sites have made their standings information publicly available or shared it with me! With their help, I think we can put to bed the concerns over lack of league history and small sample sizes. We have MANY leagues to look at now.

The fine folks at OnRoto.com have shared their NL- and AL-only standings data. If you’re not familiar with OnRoto, their goal is to cater to sophisticated fantasy leagues, many of which play by the “old-school” rules required by “long-term players”. They also are willing to fulfill just about any customization request (more on this later!).

I’ve also written several times about NFBC standings data for mixed leagues.

What follows is a close look at the 2016 12-team “only league” data from OnRoto. If you’re curious, you can see the 2015 AL information here and the 2015 NL information here.

Now, let’s take a look at the data!

AL-Only Standings by Category

Here are the average AL statistics within each rotisserie scoring category:

RK PTS AVG R HR RBI SB ERA WHIP W K SV
1 12 0.272 987 291 964 128 3.583 1.191 94 1,311 90
2 11 0.268 945 274 926 115 3.753 1.227 88 1,271 79
3 10 0.266 917 262 894 107 3.856 1.245 85 1,229 72
4 9 0.264 889 254 867 100 3.934 1.258 82 1,194 64
5 8 0.262 867 245 846 94 4.014 1.271 80 1,159 57
6 7 0.260 844 236 823 89 4.079 1.286 77 1,133 52
7 6 0.259 824 227 793 83 4.160 1.298 74 1,108 46
8 5 0.257 804 217 773 78 4.225 1.310 72 1,083 40
9 4 0.255 777 207 747 73 4.280 1.322 70 1,048 36
10 3 0.253 743 195 714 67 4.386 1.339 66 1,005 30
11 2 0.250 711 184 681 61 4.525 1.360 61 961 21
12 1 0.246 636 162 604 49 4.728 1.392 55 901 11

To better explain what you’re looking at, a team could have finished in 10th place in the standings but still finished 1st place in the home runs category. That team’s data appears on the “Rank 1” row, not on the “Rank 10” row.

NL-Only Standings by Category

And here are the NL stats:

RK PTS AVG R HR RBI SB ERA WHIP W K SV
1 12 0.276 950 257 915 164 3.411 1.183 93 1,354 88
2 11 0.272 917 244 879 143 3.596 1.217 86 1,284 76
3 10 0.269 883 231 845 133 3.710 1.232 82 1,234 68
4 9 0.267 863 222 816 122 3.810 1.253 79 1,192 61
5 8 0.264 840 214 798 112 3.902 1.270 75 1,155 54
6 7 0.263 813 206 775 106 3.994 1.284 73 1,125 49
7 6 0.261 787 198 743 99 4.080 1.297 70 1,093 44
8 5 0.259 763 191 718 92 4.173 1.313 66 1,062 37
9 4 0.258 740 184 692 85 4.241 1.329 63 1,026 33
10 3 0.255 703 174 660 78 4.351 1.347 60 991 27
11 2 0.252 673 160 630 70 4.445 1.372 55 945 20
12 1 0.249 618 143 570 56 4.631 1.406 48 826 11

Continue reading “Analyzing AL- and NL-Only Standings Data”

Standings Gain Points for NFBC Leagues

In the post that follows, I’ll share standings gain points (SGP) factors for the NFBC Main Event, NFBC Draft Championship, and NFBC Online Championship for each of the last five years (2012-2016). But I’ve got to lay some groundwork before we get there…

Raw vs. Relative

While the discussion is a bit lengthy, I think this article discussing “raw” and “relative” SGP contains one of the most significant realizations I’ve had in fantasy baseball.

The quick and dirty explanation of this realization is that it is not only the raw SGP factors (or denominators) that drive player value calculations. The relationship, or relative value, between the SGP factors is also meaningful. Not only that, but looking exclusively at raw factors can be misleading, as it is difficult to see these relationships.

To illustrate, here are two example sets of raw SGP factors for a league:

League BA R HR RBI SB
2013 15-team NFBC Main Event 0.00161 13.751 5.533 15.115 6.228
2016 15-team NFBC Main Event 0.00150 15.366 6.561 16.838 6.375

I refer to these as raw factors because they’re calculated using the standard process prescribed by SGP. A calculation is made for each scoring category and those numbers are then fed into the process that’s used to rank or assign dollar values to players.

Looking again at the table of raw data above, you might think, “Wow, what happened in the last three years that caused those significant changes in the SGP factors?”

You might even start spewing some narrative about the changing landscape of baseball, the rise in strikeouts, and the power surge MLB experienced last season.

But before you start that process, let’s take a look at those same sets of SGP factors, after they’ve been converted into relative form:

League BA R HR RBI SB
2013 15-team NFBC Main Event 0.00011 0.90976 0.36609 1.00000 0.41202
2016 15-team NFBC Main Event 0.00009 0.91256 0.38963 1.00000 0.37862

The numbers still fluctuate. And if you run the math, from 2013 to 2016 the categories changed about 10%, on average, in both the raw and relative calculations. But seeing the factors in relative form really gives me a lot more confidence in my calculations.

I was always wondering if I screwed up my calculations before making this realization. “Could RBI really have changed that much?”

To be clear, I did not develop this way of looking at the numbers. I made the realization after reading “Winning Fantasy Baseball” by Larry Schechter. Although I didn’t invent this approach, I continue to share it because I think a lot of folks are confused by the raw numbers and this confusion leads to decreased confidence in the SGP approach.

How to Calculate Relative SGP

Continue reading “Standings Gain Points for NFBC Leagues”

How to Analyze SGP Denominators from Different Sources

Do you know if the SGP calculations you’ve done for your league are accurate?

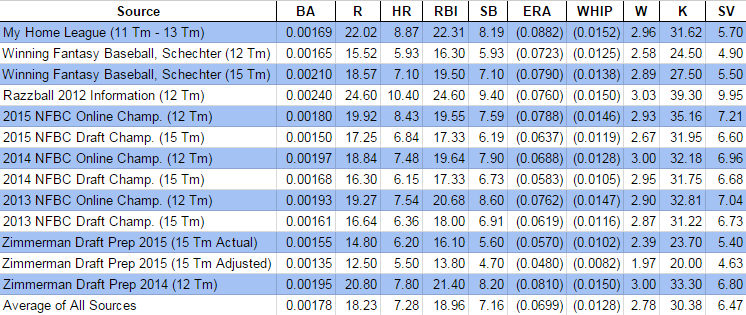
Are you concerned that your home run SGP denominator is 8.87 and Larry Schechter’s book Winning Fantasy Baseball suggests using 5.93 for a 12-team league? Or that your RBI calculation shows 22.31 and the 12-team NFBC history I just calculated shows 19.55?

What does this all mean? Will your rankings be accurate? How can they be when your denominators seem significantly different than those you see elsewhere?

Calm Down, These Numbers Are More Consistent Than You Realize

I know. You’re wondering how on Earth I can say that. How can a HR denominator of 8.87 be consistent with one of 5.93?

To be honest, I’ve had those same fears about SGP. I feel so scientific and strategic by calculating SGP. And then I look at my denominators in comparison to what I see published elsewhere and that confidence evaporates and is replaced with doubt.

In this post I’m going to share an important realization I just had about SGP (yep, I’m still learning too), show you how to properly compare your SGP denominators to different resources, and demonstrate that the dollar values calculated by different sets of denominators are more similar than you would believe. When we’re done here, I think we’ll all feel a lot more comfortable about things.

Story Time

This story starts with me calculating the SGP for the last three seasons of NFBC leagues (which make their standings information publicly available).

I read Winning Fantasy Baseball a couple years ago (if you haven’t read it and you’re about to read 2,500 words on SGP denominators, you really should get the book), and I vaguely remembered the book giving SGP denominators for a variety of league types. I wanted to verify that my findings were similar to Schechter’s.

Here’s what I found:

Source BA R HR RBI SB
2015 12-team NFBC Online Championship 0.00180 19.92 8.43 19.55 7.59
Winning Fantasy Baseball 12-team League 0.00165 15.52 5.93 16.30 5.93

Damn. WTF does this mean? Those don’t look close to me. Did I do something wrong?

A Very Important Point

As I looked more closely at the book, I noticed I missed a very important point the first time I read it. Next to each number, Schechter had calculated a “relative SGP value”.

SGP Type BA R HR RBI SB
Raw SGP Denominator 0.00165 15.52 5.93 16.30 5.93
Relative SGP Denominator n/a 1.05 2.75 1.00 2.75

And here’s the important point Schechter makes about these calculations:

… when you’re trying to adjust SGPs for leagues of various sizes, it’s important to realize that the raw value of the SGP isn’t very important, but rather the ratio of the values.

~ Larry Schechter, Winning Fantasy Baseball

Mine Is Bigger Than Yours Is

I glossed over that red bolded sentence on previous reads (because it’s not bolded red in the book…). But this small statement buried in the middle of the 350-page book is exactly the point I needed for the self-doubt I was experiencing.

So in order to hopefully save you the same trouble, take note! You can’t compare your SGP denominators to someone else’s. You have to convert them to a relative scale first.

Raw Versus Relative – An Example

Let’s focus in on just the HR and RBI stats from the table above.

SGP Type HR RBI
Raw SGP Denominator 5.93 16.30
Relative SGP Denominator 2.75 1.00

If it takes 16.30 RBI and 5.93 homers to move up the standings, this essentially means that one home run is 2.75 times more important than one RBI (home runs are more scarce, so getting one of those is more valuable than the more common commodity, RBI).

16.30 / 5.93 = 2.75

Do you remember working with fractions in elementary school? I liken this practice to that whole “lowest common denominator” charade we had to go through. Dropping the SGPs to a relative scale is like converting them to a lowest common denominator. If you leave the SGP factors grossed up at these high numbers (like 5.93 and 16.30), it’s more difficult to see the relationships you can see when they’ve been translated into the relative scale.

One More Math Concept

If you read Using Standings Gain Points to Rank and Value Fantasy Baseball Players or if you’re generally familiar with the SGP approach, you know that we would divide a player’s home run total by the home run “SGP denominator” to know how many SGP the player contributes due to his homers.

For example, if a player is projected by 30 home runs, an SGP denominator of 5.93 would indicate the player’s homers are worth 5.1 points in the standings (30/5.93=5.1). If the same player is projected for 83 RBI, an SGP denominator of 16.30 suggests the RBI are also worth 5.1 SGP (83/16.30=5.1). The 30 HR are worth the same as 83 RBI (5.1 SGP).

However, the way Larry Schechter has calculated his relative SGP would require you to multiply a player’s stats to achieve that same equality. For example, the 30 HR multiplied by 2.75 is 83 “points”. The 83 RBI multiplied by 1.00 is also 83 “points”. The 30 HR are worth the same as 83 RBI (83 relative SGP).

For Consistency, I Will Calculate Relative SGP Another Way

If you look back at the big bolded numbers above, Larry Schechter used the largest statistic (RBI for hitters and K for pitchers) as the numerator in his conversion. I will use it as the denominator.

5.93 / 16.30 = 0.364

I’m mostly doing this because everything I’ve written about SGP to this point tells you to DIVIDE BY THE SGP DENOMINATOR (heck, it’s called a denominator, meaning it’s on the bottom of the fraction). To now tell people to MULTIPLY BY THE RELATIVE SGP DENOMINATOR seems too confusing to me.

I’m sure I’ve confused the hell out of everyone at this point either way. And I apologize for this. But I think this topic is very important to understand. I’m giving it my best! Even if you’re confused, keep reading. I think this will all pull together very nicely in the end.

Going back to our example of a player with 30 HR and 83 RBI, if I divide by an SGP denominator of 0.364 I get that same 83 “points” (forgive the rounding), meaning the 30 HR are worth the same as the 83 RBI under this approach. So whether you use Schechter’s relative numerator and multiply or my relative denominator and divide, you get the same results.

How to Calculate “Relative” SGP Denominators

I’ve talked a lot about multiplying and dividing. So just to be clear, to put your SGP denominators on the same relative scale, choose the category with the largest numeric value, then divide each stat categories raw SGP denominator by that largest raw SGP denominator.

The largest numeric denominator is typically RBI for the hitting categories (the 16.30 from above is the largest SGP denominator) and strikeouts for pitching.

For the rest of this post I will be using this calculation of relative SGP denominators and NOT the way suggested in Winning Fantasy Baseball.

My NFBC Relative Versus Winning Fantasy Baseball’s 12-team Relative

Using the method described above, I calculated the relative denominators for Larry Schechter’s 12-team suggestions and my 2015 NFBC findings. Here are the results:

WINNING_FANTASY_BASEBALL

First look at the white lines. These give me that queasy feeling I was describing earlier. He’s saying 5.93 HR for a 12-team league? And I came up with 8.43? That’s 2.5 HR difference. How can these suggestions even be in the same ballpark?

Now look at the yellow-shaded lines. After everything is put on the same scale things look a lot more reasonable. When you look at all items on a relative scale, you can see many of the categories are strikingly similar (BA, R, RBI, SB, K, SV), but still show small variations. There is some variance in the other categories, but things don’t look as stark as with the raw denominators. This supports our beliefs about SGP being able to “tailor” to our league tendencies and preferences, but still leaves me feeling a lot more comfortable that my denominators are in fact closer to Larry Schechter’s than it appears on the surface.

Right around this time I’m starting to feel more comfortable with my analysis. But I’m also very curious about what happens if I start looking at SGP denominators from other sources. So I set out to find as many sources as I could find.

NOTE: After publishing this article, it came to my attention that there’s a typo in Winning Fantasy Baseball that makes this last segment somewhat less relevant. I’ve elected to keep it in despite this.

Other SGP Denominator Sources

The reliable sources I was able to locate for this analysis are:

Not bad. I was able to scrape up 13 different resources for comparison. And I threw in the average of those 13 resources as my 14th.

Here’s the Raw SGP Data

You can see things are all over the map. You can see general patterns, but the data fluctuates wildly. Some of the raw SGP denominators are almost double others. For example, Larry Schechter’s 12-team HR denominator is 5.93 while Razzball’s 2012 article calculated a 10.40!

And Here’s the Relative SGP Data

Continue reading “How to Analyze SGP Denominators from Different Sources”

How to Get Reliable SGP Data

I’m an SGP guy. Standings gain points are what I first learned. The approach has been good to me. And it seems I’ve been fairly successful using the approach. But SGP has a weakness. It’s a big weakness that prevents a lot of fantasy baseball players from using the approach.

Where Can I Get Reliable SGP Data?

Where can I find historical SGP data??? This is one of the most common questions I get about the use of standings gain points. If you’re starting a new league, don’t have access to league history, or switched website providers, you’re screwed. You can’t really start using SGP. And let’s not even mention those of you that play in AL or NL-only leagues (I still don’t have an answer for that, sorry).

In this post I’ll share with you where and how you can get great quantities of actual league standings in competitive mixed leagues (again, sorry mono-leaguers, I would love to help you one day but I haven’t found out how yet).

I got the idea to do this by reading Jeff Zimmerman’s fantasy draft prep series in 2014 and 2015.

Where Can You Find Standings Information for Competitive Leagues?

I haven’t proven the theory yet, but I’m pretty certain you could write some kind of web scraping program to pull down the standings information for public Yahoo! and ESPN leagues. But who knows what the level of competition is in those? You would have to find a way to weed out the non-competitive leagues and teams to prevent those that draft and then never change their lineup the entire season from distorting the standings information.

NFBC_LOGO

Enter the National Fantasy Baseball Championship (NFBC)

The National Fantasy Baseball Championship (NFBC) is the industry leader in premium fantasy baseball leagues. Meaning leagues that people pay an entry fee to join in an effort to win prize money.

The fact that people are paying money to enter these leagues and that prize money is at stake is the best mechanism we could hope for to ensure competitiveness. The standings information will not be tainted by schleps that draft a team and abandon in after the first week of the season.

Not only that, but the NFBC also publishes final league standings by category and makes them available to anyone! This is an SGP jackpot.

Different Types of Leagues

The NFBC has several different competitions. The two most likely to be of value to us are the “Online” and “Draft Champions” leagues. These leagues have the most entrants, so we can reduce concerns over small sample sizes. Here’s a summary of the two league types and links to the standings information for them:

NFBC League Type Standings Links Description of League
Online Overall Standings
BA, R, HR, RBI, SB
ERA, WHIP, W, K, SV
  • Standard 5×5 roto categories
  • 12 teams
  • Online 30-round draft
  • Standard 23 player lineup (14 hitters, 9 pitchers, 7 bench spots)
  • Online drafts, February through April
  • Free agency FAAB bidding proccess
  • No trading
Draft Champions Overall Standings
BA, R, HR, RBI, SB
ERA, WHIP, W, K, SV
  • Standard 5×5 roto categories
  • 15 teams
  • Online 50-round slow draft
  • Standard 23 player lineup (14 hitters, 9 pitchers, 27 bench spots)
  • Online drafts, November through April
  • Draft and hold, no free agency
  • No trading

So the big differences to note are that the “Online” leagues have 12 teams and a 30 round draft. The “Draft Champions” leagues have 15 teams and have 50-round drafts because they don’t have free agency during the season. We’ll a look at this in future posts to see if it seems to affect things.

Now That We Have This Information, What Do We Do Next?

There were 125 leagues and 1,500 teams in the 2015 Online NFBC leagues and 192 leagues and 2,880 teams in the 2015 Draft Champions leagues.

That’s a lot of data. Is there a practical way to take all of that data and use it to calculate SGP factors? Of course!

You’re Boring Me and I Don’t Want to Do This Myself

NOTE: I’m about to go through instructions how to calculate the NFBC SGP numbers yourself, but if you just want my completed analysis, you can download them here:

I may not update this information every year into the future… So remember, the instructions below will remain so you can do this yourself!

Excel Functions Used in this Post

We’ll be using the SLOPE, IF, and AVERAGEIFS formulas to calculate SGP for the NFBC leagues.

SLOPE

You can read more about the SLOPE formula in a three part series I wrote about here, here, and here.

The short description is that the SLOPE function finds the line of best fit through a given set of data points. With our rotisserie standings data, the SLOPE formula essentially calculates the actual SGP factor or denominator. I’d highly suggest reading the three part series. Or at least Part I!

IF

The IF function checks to see if a condition is met. If the condition is met, the function returns one response. If the condition is not met, the function returns another response. One important fact to realize is that the responses you specify in the IF formula can be formulas. So if the condition you specify is met, you can have the cell use formula A. And if the condition you specify is not met, you can have the cell use formula B.

The function requires three inputs:

  • Logical_Test – This is typically a formula to be evaluated. An example might be “is cell C2 greater than cell D2”.
  • Value_If_True – This is the value to be shown or the formula to be evaluated if the Logical_Test is passed,.
  • Value_If_False – This is the value to be shown or the formula to be evaluated if the Logical_Test is failed.

AVERAGEIFS

The AVERAGEIFS formula will calculate the mean of groups of cells that meet a set of conditions. You can specify multiple groups of cells and multiple conditions that must be met. The function requires three inputs (but can use more…):

  • Average_Range – These are the cells to be included in the calculation of the average
  • Criteria_Range1 – This is the first set of cells you want to be evaluated for the condition
  • Criteria1 – This is the condition that must be met for the item in the Average_Range to be included in the calculation of the average
  • If you have more conditions to be evaluated, you can continue to add pairs of Criteria_Range2 and Criteria2, Criteria_Rang3 and Criteria3, etc.

This is a little vague until I tell you more about how we will design this spreadsheet to work.

Our goal will be to design a spreadsheet containing a separate tab for each rotisserie scoring category.

ROTO_CATEGORIES

And one tab that will analyze each scoring category and calculate the average needed to finish in each place for that category. For example, this table will show what the average batting average was for each of the 15 places in an NFBC Draft Champions league.

This is what the finished spreadsheet calculating the NFBC average standings will look like.

Each cell under the roto categories will contain an AVERAGEIFS formula. For example, the table tells us that first place in the Batting Average category had an average of 0.277. The formula in this cell is set up to look on the “BA” tab for the batting average of each team (the Average_Range), then look in the “Place in League” column (the Criteria_Range1) for any rows with a “1” in them (the Criteria).

That 0.277 calculation is the average of all (and only) first place teams.

Step-By-Step Instructions to Calculate SGP for NFBC Leagues

In the instructions that follow I’ll be calculating the SGP factors from the 2015 NFBC Draft Championship standings data.

Continue reading “How to Get Reliable SGP Data”