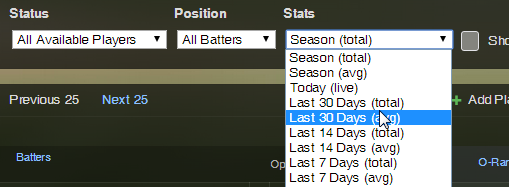
Every major fantasy league hosting site (Yahoo, CBS, ESPN) allows you to look at recent history (e.g. the last 7 days or the last 14 days). It’s also very easy to see the year-to-date stats any player has accumulated to this point in the season.

And now that we’re nearly half way through the current season, how much do those current year stats mean? If you’re trying to add a free agent, should you be looking at the last 7 days? Is the last month OK to use? How much can we expect production from the first half of the season to continue into the second half?

Let’s Take A Quiz
Before we get to the answers to those question, let’s put you to the test with some very specific questions. I’ll lay out a series of “story problem” (remember middle school math?) questions for you . Place yourself in each situation and make what you think is the best fantasy baseball decision.
Question #1
Your team recently suffered an injury and you must go out to the free agent list and find a replacement. Which of these measures is the best method of identifying the player who will perform the best for the rest of the season?
- Looking at the statistics for free agents in the last 7 days
- Looking at the statistics for free agents in the last 14 days
- Looking at the statistics for free agents in the last 28 days
- Looking at the statistics the free agents have accumulated to this point in the season (season-to-date stats)
- Looking at the projected statistics for free agents for the remainder of the season (like Steamer or Zips rest-of season projections)
Question #2
Which model(s) above do you actually use to make decisions?
Question #3
Which player would you rather have the remainder of the season given these levels of production so far?
Current production (as of 6/22/2014):
| Player | PA | R | HR | RBI | AVG |
|---|---|---|---|---|---|
| Nelson Cruz | 306 | 45 | 23 | 60 | .299 |
| Chris Davis | 252 | 32 | 12 | 37 | .220 |
Question #4
Which player would you rather have the remainder of the season given these levels of production and the Steamer RoS projections below?
Current production (as of 6/22/2014):
| Player | PA | R | HR | RBI | AVG |
|---|---|---|---|---|---|
| Nelson Cruz | 306 | 45 | 23 | 60 | .299 |
| Chris Davis | 252 | 32 | 12 | 37 | .220 |
Steamer RoS Projections (as of 6/22/14):
| Player | PA | R | HR | RBI | AVG |
|---|---|---|---|---|---|
| Nelson Cruz | 320 | 41 | 17 | 47 | .261 |
| Chris Davis | 341 | 46 | 20 | 52 | .261 |
Question #5
Similar scenario to question four above… But now imagine that we’re five full months into the season instead of at roughly the half way point. Who would you rather have in the final month of the season?
- The player who was incredibly hot for the first five months but that projections say will cool off towards his career averages or
- The player that has struggled for the first five months but is projected to improve and perform closer to his higher level of career averages over the final month of the season?
Question #6
Which player would you rather have the remainder of the season given these levels of production and the Steamer RoS projections below?
| Player | IP | K/9 | ERA | WHIP |
|---|---|---|---|---|
| Andrew Cashner | 76.1 | 6.96 | 2.36 | 1.19 |
| Homer Bailey | 90.0 | 8.07 | 4.68 | 1.45 |
Steamer RoS Projections (as of 6/22/14):
| Player | IP | K/9 | ERA | WHIP |
|---|---|---|---|---|
| Andrew Cashner | 103.0 | 7.29 | 3.85 | 1.27 |
| Homer Bailey | 95.0 | 7.99 | 3.80 | 1.22 |
The Research
The information that follows Continue reading “How Much Do Current Season Stats Matter?”
