The SFBB Excel tools are updated and ready to help you prepare for the 2025 season! If you’re looking to build skills and develop your own methods for ranking and valuing players, these are for you!
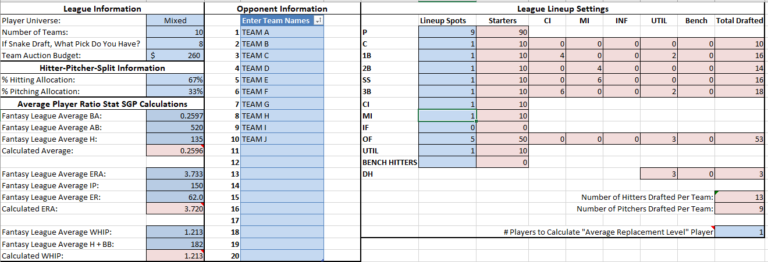
The Automated SGP Ranking Tool will help you convert your favorite projection set (Steamer, The Bat, Razzball, RotoWire, PECOTA, etc.) into Excel-based rankings and dollar values tailored to your own league’s settings. The process takes only minutes. No messy Excel formulas. Just load your projections into the file, adjust a few settings, and standings gain points rankings are calculated automatically. Click here to read more about the tool.
Powered by the same concepts as the Automated SGP Ranking Tool, the Automated Points League Ranking Tool does all the same things, just for nearly any imaginable points league. The tool works with any popular projection set and allows you to enter your league’s unique point scoring system, then instantly converts those projections into tailored point totals and dollar values. The process take minutes and will give a huge advantage over owners that are not tailoring rankings specifically to the league scoring system. Click here to read more about the points league tool.
An easy-to-use Excel spreadsheet that can combine (or average) up to five different projection sets. The aggregator can use just about any well-known projection set you can find on the web (if you find one that doesn’t work, let me know!). Simply download your favorite projection sets, fill out some settings, and you’re done. No complicated formulas or VLOOKUPS for you to add.
The SFBB Excel tools are updated and ready to help you prepare for the 2024 season! If you’re looking to build skills and develop your own methods for ranking and valuing players, these are for you!
The Automated SGP Ranking Tool will help you convert your favorite projection set (Steamer, The Bat, Razzball, RotoWire, PECOTA, etc.) into Excel-based rankings and dollar values tailored to your own league’s settings. The process takes only minutes. No messy Excel formulas. Just load your projections into the file, adjust a few settings, and standings gain points rankings are calculated automatically. Click here to read more about the tool.
Powered by the same concepts as the Automated SGP Ranking Tool, the Automated Points League Ranking Tool does all the same things, just for nearly any imaginable points league. The tool works with any popular projection set and allows you to enter your league’s unique point scoring system, then instantly converts those projections into tailored point totals and dollar values. The process take minutes and will give a huge advantage over owners that are not tailoring rankings specifically to the league scoring system. Click here to read more about the points league tool.
An easy-to-use Excel spreadsheet that can combine (or average) up to five different projection sets. The aggregator can use just about any well-known projection set you can find on the web (if you find one that doesn’t work, let me know!). Simply download your favorite projection sets, fill out some settings, and you’re done. No complicated formulas or VLOOKUPS for you to add.
The SFBB Excel tools are updated and ready to help you prepare for the 2023 season! If you’re looking to build skills and develop your own methods for ranking and valuing players, these are for you!
The Automated SGP Ranking Tool will help you convert your favorite projection set (Steamer, The Bat, Razzball, RotoWire, PECOTA, etc.) into Excel-based rankings and dollar values tailored to your own league’s settings. The process takes only minutes. No messy Excel formulas. Just load your projections into the file, adjust a few settings, and standings gain points rankings are calculated automatically. Click here to read more about the tool.
Powered by the same concepts as the Automated SGP Ranking Tool, the Automated Points League Ranking Tool does all the same things, just for nearly any imaginable points league. The tool works with any popular projection set and allows you to enter your league’s unique point scoring system, then instantly converts those projections into tailored point totals and dollar values. The process take minutes and will give a huge advantage over owners that are not tailoring rankings specifically to the league scoring system. Click here to read more about the points league tool.
An easy-to-use Excel spreadsheet that can combine (or average) up to five different projection sets. The aggregator can use just about any well-known projection set you can find on the web (if you find one that doesn’t work, let me know!). Simply download your favorite projection sets, fill out some settings, and you’re done. No complicated formulas or VLOOKUPS for you to add.
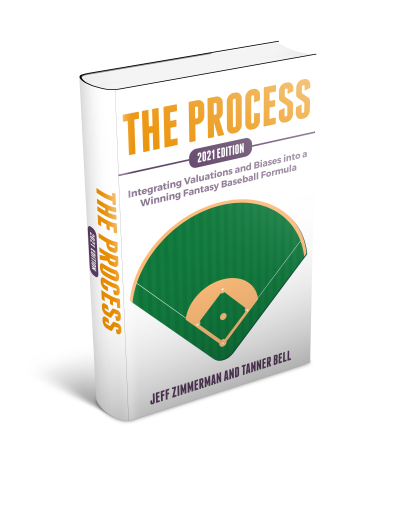
This year’s edition of The Process contains many exciting new updates, studies, standings, and SGP data. Visit thefantasybaseballprocess.com to read many more details.
The SFBB Excel tools are updated and ready to help you prepare for the 2022 season! If you’re looking to build skills and develop your own methods for ranking and valuing players, these are for you!
The Automated SGP Ranking Tool will help you convert your favorite projection set (Steamer, The Bat, Razzball, RotoWire, PECOTA, etc.) into Excel-based rankings and dollar values tailored to your own league’s settings. The process takes only minutes. No messy Excel formulas. Just load your projections into the file, adjust a few settings, and standings gain points rankings are calculated automatically. Click here to read more about the tool.
Powered by the same concepts as the Automated SGP Ranking Tool, the Automated Points League Ranking Tool does all the same things, just for nearly any imaginable points league. The tool works with any popular projection set and allows you to enter your league’s unique point scoring system, then instantly converts those projections into tailored point totals and dollar values. The process take minutes and will give a huge advantage over owners that are not tailoring rankings specifically to the league scoring system. Click here to read more about the points league tool.
An easy-to-use Excel spreadsheet that can combine (or average) up to five different projection sets. The aggregator can use just about any well-known projection set you can find on the web (if you find one that doesn’t work, let me know!). Simply download your favorite projection sets, fill out some settings, and you’re done. No complicated formulas or VLOOKUPS for you to add.
This post is intended to be an all-encompassing discussion of the Player ID Map tool. Click the links below to jump directly to a specific section below. Use the Back browser or mouse button to jump back to this list.
The MLB and fantasy baseball landscapes are wide reaching. We fantasy players gather information, projections, and opinions from many locations. Any time you have a situation like this, where data is coming from many disparate places, some form of “mapping” table can help connect the dots and data points from these different sources.
If you’ve ever tried to line projections from Fangraphs up with projections from Baseball Prospectus, Mastersball, or Baseball HQ, you’ll understand this challenge. You may have tried a VLOOKUP in Excel or Google Sheets to line the data up side-by-side. But player names are not a great mechanism to do this. Names can change (see Nick Castellanos and Nicholas Castellanos or B.J. Upton and Melvin Upton). Name conventions can differ between sites (see A.J. Pollock and AJ Pollock or Ronald Acuna and Ronald Acuna Jr.). Even worse, there are occasionally duplicate names (Chris Young being a recent example).
The Player ID Map solves these discrepancies. It enables an owner to line up an A.J. Pollock in their spreadsheet to an AJ Pollock from projection system. The Player ID Map is the bridge that has enabled me to build tools like the Projection Aggregator and the Automated SGP Ranking Tool. It enables building spreadsheet tools and other solutions that can work with or link to major sports websites (ESPN), projection systems (Steamer, Razzball, Mastersball, ATC), and fantasy baseball providers (NFBC, Fantrax, Yahoo!, Draftkings).
What Versions of This Tool are Available?
All the different “versions” below are pointing to the same source information. They are just different formats of using or viewing the data.
Excel Version (LINK) – A downloadable Excel file that can be incorporated into your own fantasy baseball spreadsheets. The data in this file contains connections to the main version I maintain in an online Google Sheet. This version will likely be out of date when it is downloaded, but instructions on how to refresh the data through the connection to the Google sheet are easy-to-follow and are included later in this post. The Excel version contains two tabs:
PLAYERIDMAP – All available IDs and naming system information that I track
Change Log – Explanations of changes made, including additions, corrections, and dates these changes were made
Web Version of PLAYERIDMAP (LINK) – A live look at the html/web-based version of the PLAYERIDMAP tab in the live Google Sheet. You might use this if you just want to see the Player ID Map or look for specific pieces of information
CSV Version of PLAYERIDMAP (LINK) – A one-time CSV download of the Player ID Map tab of the live Google Sheet. I wouldn’t really recommend using this because there is no connection back to the live data I maintain, like in the Excel version. But it could be used if you only need an easy-to-use one-time dump of the data.
Web Version of Change Log (LINK) – A live look at the html/web-based version of the Change Log tab in the live Google Sheet. This could be used to review recent changes to the central Sheet and determine if a refresh is needed.
CSV Version of the Change Log (LINK) – I have no idea why I make this available. Seems like it wouldn’t be valuable at all! But it’s here if you need it. It’s a one-time CSV download of just the Change Log tab.
How Do I Update or Refresh the Player ID Map?
Note, you will be prompted about the potential danger of downloading Excel files from the internet the first time you download and open the Player ID Map. There are no dangerous macros or harmful code embedded in the file. It does maintain a connection back to my Google source file to enable you to download updated information. Click “Enable Editing” to accept this reminder and be able to interact with the Excel file.
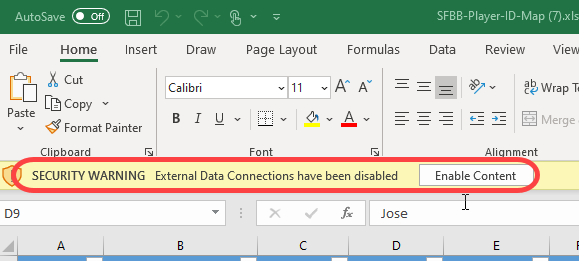
You may at times also see an Excel warning that external data connections can be harmful. These are common warning messages and good reminders that you do have to be careful what you download on the web. Click “Enable Content” to allow the data connection to pull in refreshed player ID data.
If you trust me and do download the Excel file, here’s how to refresh it.
Step
Description
1.
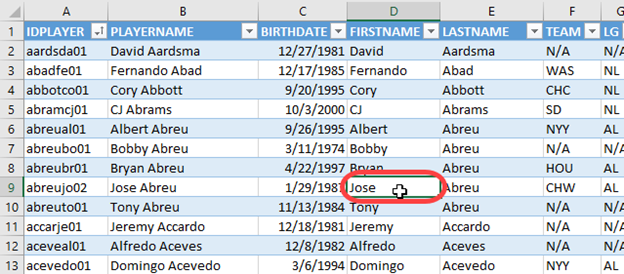
Select a cell inside of the player ID data. It does not matter which player or piece of data. It just has to be something inside the blue and white table.
2.
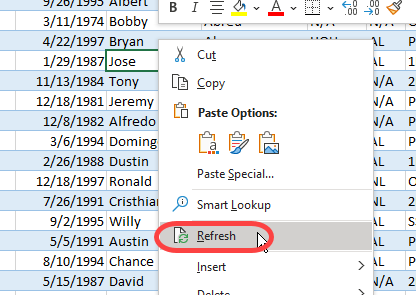
Right-click on the selected cell and choose the menu option to “Refresh”.
3.
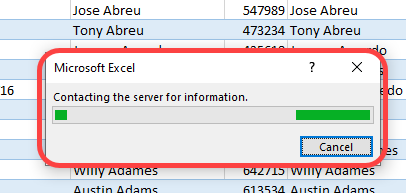
You will begin to see various status messages as Excel begins to refresh the connection. You may see information being relayed in the bottom right of Excel.
A popup may appear. And status information may even appear in the bottom left of Excel (I couldn’t grab a screenshot quick enough).
The entire refresh may take 60 seconds or so. And it may depend on how much time has transpired since your last update. You don’t really get a “This is Done!!!” message. You’ll just know you’re ready to proceed when all the statuses stop changing.
Origin
I created the Player ID Map in 2013. I started my ID map largely from information from Tim Blaker’s map. Tim continues to provide updates in his mapping file, but our maps have different purposes. I needed the flexibility to add new names and systems and not be reliant upon someone else. But I continue to use Tim’s map as an input to mine when I’m performing major updates for new players that enter the baseball world.
The Player ID Map has grown since 2013. I continue to add new systems, new name formats, and even new information about each player that will help me provide spreadsheet tools the the SFBB audience.
Do People Really Use This Thing?
I’m surprised at how often it’s used. At the time I write this article, the file has been downloaded or refreshed over 280,000 times (Who knows. 200,000+ of them could be me tinkering in spreadsheets). If I could only figure out a way to charge ten cents each time it’s used…
It’s an integral part to building long-lasting and flexible fantasy baseball spreadsheets that can take advantage of many different sources of baseball data.
Does the Player ID Map Include All MLB Players?
No. The tool is intended to be used for fantasy baseball purposes. Accordingly, the goal is to include only “fantasy relevant” players. That’s a purposely vague threshold. In the preseason, I generally keep the top 750ish players accordingly to NFBC ADP included in the Player ID Map. This should be enough players to cover most normal leagues. It’s possible the Player ID Map will not be deep enough for your 20-team NL-only league, your AL Central-only league, or your middle-reliever contest. Keep reading for advice on how to get more players added to the Player ID Map.
Looking to get a jump on the 2021 season? Here are the Excel tools and books that are updated and ready to help you prepare for the upcoming season. If you’re looking to build skills and develop your own methods for ranking and valuing players, these are for you! All of the spreadsheet tools listed below have been updated for the 2021 season.
We are sorry to announce that there will not be major updates to The Process for the 2021 edition. Among other things, the shutdown and restarting of the season, the rule changes, the odd schedules, and the seven-inning games would have us questioning the validity of any innovative research.
With that in mind, we’ve decided to offer two editions this year, so our readers can choose the version that’s right for them.
2021 Appendix Edition (PDF) – $7.99
This is the edition for owners that have previously read the 2020 edition and are now looking for updated 2021 appendix data. This slimmed-down version contains just the 65-page appendix containing SGP analysis, Steamer projections, standings data for 2018-2020, and Jeff and Tanner’s thoughts on how to use the standings data from the 2020 season. Click here to purchase the Appendix Only 2021 Edition in a PDF e-book format for $7.99.
Full 2021 Edition (PDF) – $17.99
If you have not previously bought the book, this is the edition for you. The body of this book is the same as the 2020 edition, with an updated appendix. The appendix is updated for various leagues’ standings gains points (SGP), 2021 Steamer projections with the SGP, projected handedness splits, and others. Click here to purchase the Full 2021 Edition in a PDF e-book format for $17.99.
The Automated SGP Ranking Tool will help you convert your favorite projection set (Steamer, The Bat, Razzball, RotoWire, PECOTA, etc.) into Excel-based rankings and dollar values tailored to your own league’s settings. The process takes only minutes. No messy Excel formulas. Just load your projections into the file, adjust a few settings, and standings gain points rankings are calculated automatically. Click here to read more about the tool.
Powered by the same concepts as the Automated SGP Ranking Tool, the Automated Points League Ranking Tool does all the same things, just for nearly any imaginable points league. The tool works with any popular projection set and allows you to enter your league’s unique point scoring system, then instantly converts those projections into tailored point totals and dollar values. The process take minutes and will give a huge advantage over owners that are not tailoring rankings specifically to the league scoring system. Click here to read more about the points league tool.
An easy-to-use Excel spreadsheet that can combine (or average) up to three different projection sets. The aggregator can use just about any well-known projection set you can find on the web (if you find one that doesn’t work, let me know!). Simply download your favorite projection sets, fill out some settings, and you’re done. No complicated formulas or VLOOKUPS for you to add.
Looking to get a jump on the 2020 season? Here are the Excel tools and books that are updated and ready to help you prepare for the upcoming season. If you’re looking to build skills and develop your own methods for ranking and valuing players, these are for you! All of the spreadsheet tools listed below have been updated for the 2020 season.
Co-authored with Jeff Zimmerman, this is our comprehensive guide of the process we use to succeed during a fantasy baseball season. From preseason preparations, the draft, and all the stages of the season, it’s everything we know about playing this game. The book is available in a PDF e-book for $17.99 here or in paperback form at Amazon here.
You can read a comprehensive writeup of all that’s included in the book here, including the foreword by Clay Link, the full table of contents, and testimonials by fantasy analysts like Rob Silver, Rudy Gamble, Eno Sarris, Mike Podhorzer, and Mike Gianella.
The Automated SGP Ranking Tool will help you convert your favorite projection set (Steamer, The Bat, Razzball, RotoWire, PECOTA, etc.) into Excel-based rankings and dollar values tailored to your own league’s settings. The process takes only minutes. No messy Excel formulas. Just load your projections into the file, adjust a few settings, and standings gain points rankings are calculated automatically. Click here to read more about the tool.
Powered by the same concepts as the Automated SGP Ranking Tool, the Automated Points League Ranking Tool does all the same things, just for nearly any imaginable points league. The tool works with any popular projection set and allows you to enter your league’s unique point scoring system, then instantly converts those projections into tailored point totals and dollar values. The process take minutes and will give a huge advantage over owners that are not tailoring rankings specifically to the league scoring system. Click here to read more about the points league tool.
An easy-to-use Excel spreadsheet that can combine (or average) up to three different projection sets. The aggregator can use just about any well-known projection set you can find on the web (if you find one that doesn’t work, let me know!). Simply download your favorite projection sets, fill out some settings, and you’re done. No complicated formulas or VLOOKUPS for you to add.
Ever wanted to create your own rotisserie rankings? This is my instructional guide written specifically to show you how to create customized rotisserie player rankings, dollar values, and inflation dollar values, in Microsoft Excel, tailored to your own league. No more downloading rankings from the web, hoping they apply to your unique league. 10, 12, or 15-team league? $260 or $300 budget? AL-only or mixed league? 10 hitters or 14? It doesn’t matter. This book will guide you through the process of developing rankings for just about any kind of rotisserie league.
My step-by-step guide to building custom rankings, dollar values, and inflation dollar values, in Microsoft Excel, for your points league. This book will guide you through the process of developing rankings for just about any point-based scoring format.
I’m a firm believer that using customized projections and running those through a valuation system, like standings gain points, is the single biggest leap a fantasy owner can take in improving at fantasy baseball. The problem with taking that step is it’s a significant hurdle to get over.
It’s complicated. It takes learning advanced Excel skills. It’s time consuming. It’s not for everyone.
I’ve been hard at work to help solve these problems. It’s taken several years, but I’m finally able to announce the new Automated SGP Rankings Excel Tool. With this Excel tool, you’ll be able to calculate rankings and dollar values from your favorite projection set within minutes. You can use Steamer, any other Fangraphs projection set, Rotowire, Mastersball, and even PECOTA. Whatever projection set you have access to should work.
Interested in learning more about this tool? Watch the following video or click here to read all about its features.
The Automated SGP Rankings Excel Tool is now available for the 2019 season! This tool will save you huge amounts of time. You won’t be stuck troubleshooting Excel formulas. You can focus on player research and forming your own opinions about players. You’ll have custom dollar values to make decisions from. Those values will be tailored to your league’s specific settings. It’s a great step toward winning your league this upcoming season.
The Excel tool currently works with the following rotisserie categories:
Hitting Categories
Pitching Categories
Runs (R)
Wins (W)
Home Runs (HR)
Saves (SV)
Runs Batted In (RBI)
Strikeouts (K)
Stolen Bases (SB)
Earned Run Average (ERA)
Batting Average (BA)
Walks + Hits per Inning Pitched (WHIP)
On Base Percentage (OBP)
Quality Starts (QS)
Slugging Percentage (SLG)
Holds (HD)
On Base Plus Slugging (OPS)
Saves + Holds (SV+HD)
Click here to read more about its features and to purchase the tool.
I partnered Jeff Zimmerman (Fangraphs, Rotowire, Fantrax, multiple-time Tout Wars Champ) to write this comprehensive e-book guide (PDF) that outlines the start-to-finish process we go through during a fantasy baseball season. Please click here to buy The Process e-book.
How to Win Your League
The book is a chronological guide through the fantasy baseball season, with the main goal being to help you win your league. The topics covered are:
Use of Projections
How to Adjust Projections
How to Convert Projections to Values/Rankings
How to Adjust Values and Rankings
Draft & Auction Preparation
Draft & Auction Strategy
In-season Management & Strategy
End-of-season Management & Strategy
Wrapping Up the Season
As you read through that list, you may be thinking, “I already know that topic,” or, “What more could be said about that?” But that is what I’m most proud of. I think we managed to provide unique perspective, insights, and studies that have not been seen before.
If you’re not an experienced owner and you’re looking for a place to start, The Process can help you too. It is a comprehensive guide, but we also present shortcuts and alternate ways of doing things. You can pick and choose the topics or areas in which you want to expand your game. Adding one or two new strategies or tactics to your own process each season is a great way to improve over time.
I’m also very proud of the way we were able to weave in a lot of theory, so owners are not just presented with a way of doing things, but can also understand the “why”, so it can be applied to similar situations in the future.
Cognitive biases and other decision-making concepts are also sprinkled throughout the book. We believe this combination of process, theory, and decision-making tactics makes The Process a unique tool for fantasy owners.
Tell Me More About What’s Included
One of the more interesting studies included in the book is around the concept of weekly player values. Much of the research and decision-making fantasy owners do centers around annual valuations for players. Yet outside of draft and hold leagues, we don’t make decisions on an annual time horizon. Most owners must make decisions on a weekly or even daily basis. A study of weekly player valuations sheds light on how well we capture value in the preseason, what kinds of players create weekly value, and when new value appears during the season.
The book also includes average standings data and standings gain points calculations for many popular league variations. Save hours of time having to calculate these yourself!
This data is provided for the following league types:
15-team, Standard League (14 hitters, 9 pitchers)
15-team, 1-Catcher League (2 utility hitters)
15-team, OBP League (instead of batting average>
15-team, Draft and Hold League (no in-season pickups)
12-team, Standard League
12-team, OBP League
12-team, AL-only Standard League
12-team, NL-only Standard League
12-team, AL-only OBP League
12-team, NL-only OBP League
What Do Others Have to Say?
You don’t just have to take my word for it. Some of the minds I most respect in the fantasy baseball community have taken the time to read the book and offer their feedback (Rob Silver, Rudy Gamble, Eno Sarris, Mike Podhorzer, Mike Gianella). You can see what they had to say here.
Please Click the ‘Buy Now’ Button Below to Purchase the e-Book for $17.99
After clicking the “Buy Now” button, you’ll be taken through an online checkout process using PayPal. There is also an option to pay with a debit or credit card. After completing the purchase, a link to download the PDF book will immediately be e-mailed to you. You can read the PDF on any mobile device, PC, or tablet.
As much as I love the standings gain point approach to valuing players, it does have an a couple of inherent weaknesses.
First, it’s dependent upon some form of league history to work. The whole ranking and valuation process is derived from previous standings data! Those starting new leagues, or joining an existing league, don’t have this information available.
Second, assuming you have prior standings to draw from, I’ve always been bothered by the small sample sizes of that data. And I don’t know about you, but something odd always seems to happen in my leagues. One year someone runs away with it, one year it’s a tight race between five teams, one year we add two teams, the next year we contract a team.
Thankfully, some very generous league hosting sites have made their standings information publicly available or shared it with me! With their help, I think we can put to bed the concerns over lack of league history and small sample sizes. We have MANY leagues to look at now.
The fine folks at OnRoto.com have shared their NL- and AL-only standings data. If you’re not familiar with OnRoto, their goal is to cater to sophisticated fantasy leagues, many of which play by the “old-school” rules required by “long-term players”. They also are willing to fulfill just about any customization request (more on this later!).
I’ve also written several times about NFBC standings data for mixed leagues.
Here are the average AL statistics within each rotisserie scoring category:
RK
PTS
AVG
R
HR
RBI
SB
ERA
WHIP
W
K
SV
1
12
0.272
987
291
964
128
3.583
1.191
94
1,311
90
2
11
0.268
945
274
926
115
3.753
1.227
88
1,271
79
3
10
0.266
917
262
894
107
3.856
1.245
85
1,229
72
4
9
0.264
889
254
867
100
3.934
1.258
82
1,194
64
5
8
0.262
867
245
846
94
4.014
1.271
80
1,159
57
6
7
0.260
844
236
823
89
4.079
1.286
77
1,133
52
7
6
0.259
824
227
793
83
4.160
1.298
74
1,108
46
8
5
0.257
804
217
773
78
4.225
1.310
72
1,083
40
9
4
0.255
777
207
747
73
4.280
1.322
70
1,048
36
10
3
0.253
743
195
714
67
4.386
1.339
66
1,005
30
11
2
0.250
711
184
681
61
4.525
1.360
61
961
21
12
1
0.246
636
162
604
49
4.728
1.392
55
901
11
To better explain what you’re looking at, a team could have finished in 10th place in the standings but still finished 1st place in the home runs category. That team’s data appears on the “Rank 1” row, not on the “Rank 10” row.
“The Process”, My Latest Book, with Jeff Zimmerman
The 2024 edition of The Process, by Jeff Zimmerman and Tanner Bell, is now available! Click here to read what folks like John Pausma, Phil Dussault, Eno Sarris, Clay Link, Rob Silver, Rudy Gamble, and others have to say about the book.
The Process is your one-stop resource for better drafting, in-season management, and developing strategies to become a better manager. The book is loaded with unique studies, tips, and strategies you won't find anywhere else. Click here for more details.