How To Track Drafted Players In A Spreadsheet

I’ll paraphrase a reader question I recently received:

Hey, you with your big fancy spreadsheets.  I need a way to easily hide the players that have already been drafted so I don’t waste time digging around in a bunch of players that are no longer available.  Have any tips?

– Bill

Great question.  Let me show you how I do this.

But First…

We have three key Excel concepts or features you should understand.  If you’re already familiar with these, just skip down to the step-by-step instructions below.

  1. Named Ranges
  2. Data Validation
  3. Filtering

Named Ranges

Excel allows you to create names for groups or blocks of cells.  Once established you can use this name in formulas instead of having to fully spell out the entire range of data again.  I find it a lot easier to deal with a name like “TeamNames” than it is to explicitly specify the area of a range like “Settings!$A$1:$A$10”.  Named ranges are a lot easier to remember and a lot less likely to result in errors.

Data Validation

Data validation ensures that information entered in a cell or calculated by the Excel fits specified criteria.    You could validate that information entered in the cell is a date or is larger than 0, for example.

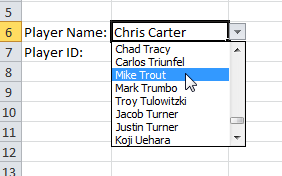
In the example below we will create a drop down menu that lists each team in your fantasy league and validates that the selected value is spelled correctly and corresponds to a team in your league.

Filtering

Filtering is a function in Excel that allows you to hide entire rows of data that don’t meet certain requirements.  In this example we will filter the list of players to hide players that have been given a team (they have been drafted).

Step-By-Step Instructions

The following instructions will take you through the process of adding a column to track which players have been drafted and which team in your league selected each player.  We will create a drop down menu that lists all teams in your league and use this to document who was drafted and by what team.

These instructions assume you have some kind of a starting spreadsheet containing projections and rankings already.  If you don’t have such a starting point, skip to the end of this post for information on how to get here. Continue reading “How To Track Drafted Players In A Spreadsheet”

Web Queries Part 2: How To Make a Dynamic Excel Web Query

We’re about to take web querying to the next level.  If you’re not familiar with web queries or if you missed our first discussion, you can brush up on Excel web query basics in Part 1 the Web Queries Series here (ha, that rhymes).

This will also make more sense if you’re familiar with the concepts of player IDs and website URLs discussed in this post.

The Weakness In Our First Query

You might recall that our first web query was specifically linked to Jose Fernandez’s player page at BrooksBaseball.net.  This is a great way to pull his specific pitch mix into an Excel file.  But it’s also pretty limiting that we can only pull in Jose Fernandez’s statistics and would have to create a new query to look up another player.  At that point it’s faster to just go to BrooksBaseball.net and start searching for players manually.

What is a Dynamic Web Query?

A dynamic query would be designed in such a way so that we only have to initially set up one query.  That query is not static, linked to one specific page or player, it’s dynamic, meaning it is linked to an input that can change.
Said another way, instead of linking the web query to player ID “11530“, link the web query to a specific cell in Excel.  Then whatever player ID is typed into that cell will be used in the web query.

A New Example

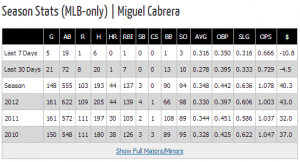
Instead of linking to BrooksBaseball.net, we’ll link to the player pages at Razzball.com. miguel_cabrera_razzballIf you haven’t checked them out, these player pages over are an incredible resource.  Take a look at Miguel Cabrera’s page using this link:

http://razzball.com/player/1744/Miguel+Cabrera/

And just to illustrate something about the URLs at Razzball, try this link:

http://razzball.com/player/1744/

They load to the same page.  The player’s name is not necessary for the page to load.

Stop Blabbering And Asking Me To Read Things.  Show Me How To Do This.

Sorry about that.  Video is more conducive to understanding this dynamic web query example.  Here you go:

Have Any Questions?

Don’t just watch the video.  Give this a try.  You could use this to more easily do projections, evaluate trades, set the ideal daily fantasy lineup, and much more.

If you like getting your hands dirty in Excel and doing player analysis like this, sign up for the Smart Fantasy Baseball newsletter where you’ll get more great ideas like this.

Be smart.

Player ID Map Updated For 2014

If you’re looking to get a jump start and create your own rankings for the 2014 fantasy baseball season, the SFBB Player ID Map has been updated for those players expected to be “fantasy relevant”.  ESPN’s player IDs have also been added to the spreadsheet.

You can download the updated map here.

A complete list of changes can be found in the “Change Log” tab of the spreadsheet.

ESPN_Player_ID

Some of the more notable additions to the Player ID Map are:

  • Jose Fernandez
  • Sonny Gray
  • Wil Myers
  • Anthony Rendon
  • Bruce Rondon
  • Zack Wheeler
  • Kolten Wong
  • Mike Zunino
  • Michael Wacha
  • Yasiel Puig
  • Xander Bogaerts
  • Brad Miller
  • Danny Farquhar
  • Danny Salazar
  • Taijuan Walker

If you’re new to the site, consider checking out these past posts that illustrate some interesting things you can do with player IDs.

Please let me know if I’ve missed anyone.  Stay smart.


Web Queries Part 1: How to Make Your First Excel Web Query

Did you know there is an easy way to grab baseball statistics from web pages and easily pull the data into Excel?  And if that same data on the web changes, the new information will automatically pull into your Excel file.  The function in Excel is called a “web query” and it’s pretty amazing stuff.  I’ll show you how to make your first web query in the post to follow

Credit Where Credit Is Due

I recently learned of web queries when I was looking into features in Excel 2013, and more recently I came across the idea being applied to baseball statistics in Joseph Adler’s book, Baseball Hacks: Tips & Tools for Analyzing and Winning with Statistics.  If you enjoy the Excel and data analysis articles here at SmartFantasyBaseball.com, you need to get your hands on a copy of “Baseball Hacks”.  I cannot recommend it enough.  Web queries are only one of the 75 different “hacks” in the book.

Please note that I only recommend resources that I think are extremely valuable and that I use myself.  The links to Baseball Hacks above are affiliate links, through which I earn a small commission if you were to purchase the book. The book will cost you the same if you directly go to Amazon and search for it. If you prefer a generic link through which I receive no benefit, use this.

Acquire A Target

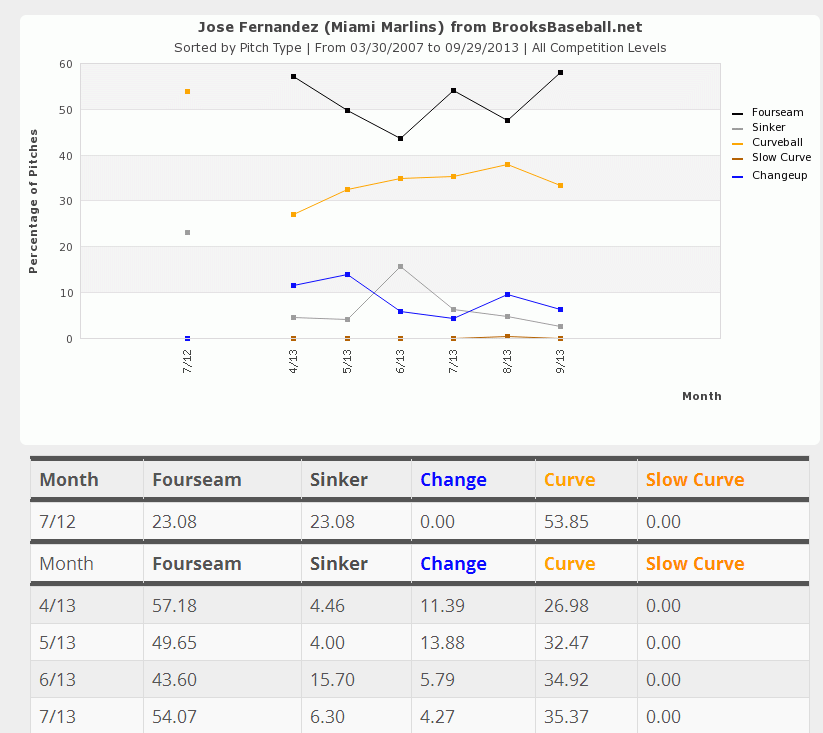
The first thing you’ll need to do is identify a web page that has the data you want to grab.  The information has to be in a table format.  For this first example we’ll go to one of my favorite sites, Brooksbaseball.net, and pull in the pitch type usage information for Jose Fernandez.

If you visit the link above or look at the image below, you can see the percentage use of each type of pitch is presented in a tabular format (below the graph).  It is this table that we will now link to an Excel file.

ImportHTML23
Image and pitch data courtesy of BrooksBaseball.net

Making Your First Web Query

You can watch the video or refer to the written step-by-step instructions below. Continue reading “Web Queries Part 1: How to Make Your First Excel Web Query”

3 Free Alternatives to Microsoft Excel Every Fantasy Baseball Manager Should Know

Microsoft Excel is my go-to spreadsheet application, but what if you don’t have access to Excel?  After all, it’s expensive to purchase ($100+).  Are you out of luck when it comes to being a data-driven fantasy baseball player?

Hardly.  There are several free options available and they’re more comparable to Excel than you might think.

Microsoft One Drive (Online Access to a Free Version of Excel)

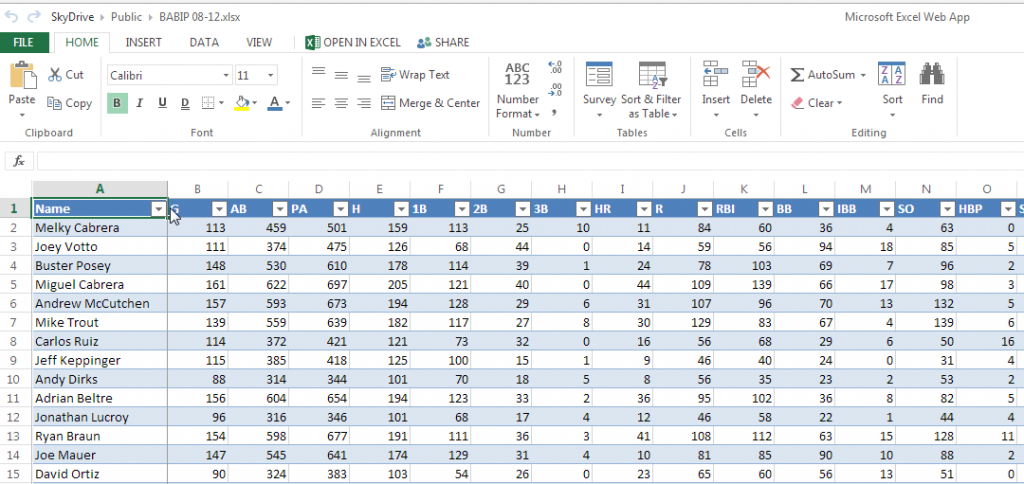
You can set up an online Microsoft OneDrive account free of charge.  This gets you access to a free online version of Microsoft Excel that offers most of the capabilities available in the desktop version.  You can see a screenshot of the program below.
ExcelAlt1

It’s definitely a viable spreadsheet application.  It offers nearly all the built in functions (VLOOKUP, SUM, IF, etc.) of the traditional Microsoft Excel.  It can meet the needs of any basic to moderately complex spreadsheet.

But there are several features I like to include in more advanced spreadsheets (like the sheet created in the SmartFantasyBaseball “Create Your Own Fantasy Baseball Rankings” series), that can’t be utilized in this online version of Excel.  Most notably, you cannot create named cells or named ranges.  Additionally, you cannot set up data validation, like drop down menus.  These aren’t deal breakers, you can likely work around the absence of these items.  But they’re definitely nice to have.

I’m also not aware of a way to link one Excel Sky Drive file to the data in another file saved in Sky Drive.  This would be nice if you have one central Excel file that stores a lot of data and you want to be able to access it from multiple files that will rely upon that data.  I don’t typically link documents together in this fashion, but it’s good to know.  Online Excel files do have certain file size limitations that might make linking necessary (and you won’t be able to do it).

Google Drive (Free Online Access to Google’s Spreadsheet application)

If you have a Gmail account or if you register for a free Google account, you get access to Google Drive and free online file storage.  You then get access to use Google’s free online word processor, spreadsheet, and presentation applications.
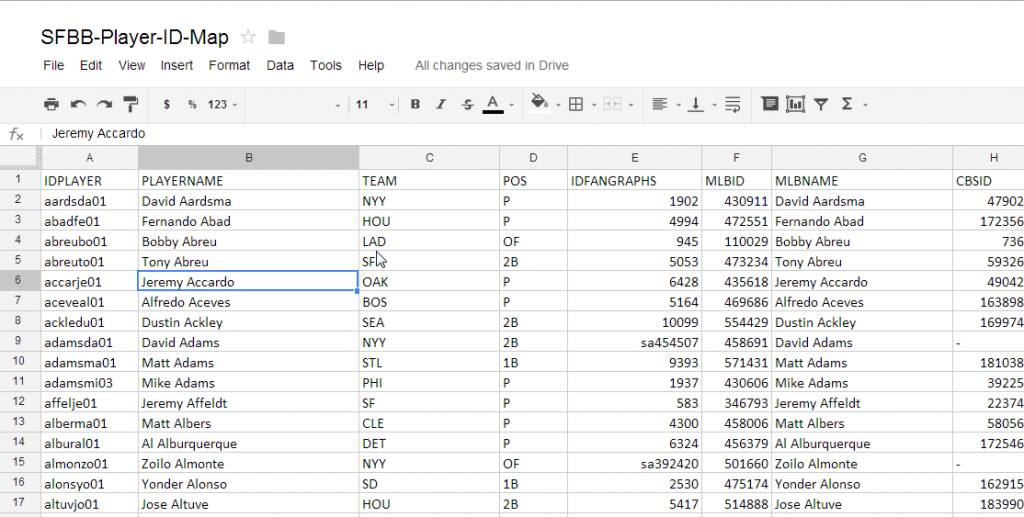
ExcelAlt2

In my opinion, Google offers a more comprehensive online solution than Microsoft does. I find file management is a lot easier in Google’s interface.  And within a Google Spreadsheet, you can use some of the advanced features not available in the online version of Excel.  For example, you can create named ranges, link to other Google spreadsheets, and even pull in other content on the web.

I’ve created several complicated spreadsheets within Google documents using named ranges, upwards of 100 tabs, and linking to external Google Spreadsheets documents, and I’ve been very happy with the results.

Open Office (Free Suite Of Office-Like Applications)

I do think Google’s online spreadsheet application is a strong alternative, but no online spreadsheet is going to replace the capabilities of a spreadsheet saved, accessed, and run directly from your own computer.

When working on your own computer (as opposed to a spreadsheet running over the web), the functionality is improved, calculations are processed faster, the program is more powerful, and the usability is much better.  Fortunately, we have OpenOffice, which is a free alternative to Microsoft Office’s product line.  OpenOffice has a spreadsheet, word processor, and presentation application, all available free of charge.

Millions of people use the OpenOffice suite and the look and feel of the programs is similar to older Microsoft Office interfaces.  If you’re used to the Ribbon interface used by Microsoft Office products in the last several years, the menu systems may feel antiquated.  But the program gets the job done.

OpenOffice file formats are generally interoperable with Microsoft file formats, meaning you can save OpenOffice documents and spreadsheets into Office file formats for sharing with Office users.
ExcelAlt3

My Recommendation

I enjoy the more robust experience of running a spreadsheet application from the computer, as opposed to one running of the web, but I really like the experience of using Google Drive and the Google spreadsheet application.  If you’ve read some of my longer posts you’ll know that I’m a fan of using named ranges, and that gives Google a big advantage of Microsoft Excel’s online web app.  I also use Gmail and find the Google Drive app for my phone is very easy to use and access data from.

So I think it comes do to your own preferences and if you prefer a traditional program running on your computer or if you like the mobility, access, and backup benefits offered by a web-based application.  OpenOffice is a very strong (and free!) option to run locally.  And Google wins the web app battle, in my mind.

Conclusion

Don’t think you can’t implement the ideas or use the tools from SmartFantasyBaseball just because you don’t have access to Microsoft Excel.  There are high quality and free alternatives available to you.

Be smart.
 

Fun With URLs and Player IDs

Here’s a quick tip that can save you a lot of time if you maintain a spreadsheet of player projections, a list of player rankings, or if you’re simply looking for a more efficient way to do player research.

Hypothetical

URL4Let’s say you have a list of ten free agent pitchers you want to look up at BrooksBaseball.net.  You have a preference for pitchers that limit fly balls (thus limiting home runs), have a variety of pitches at their disposal, and you also want to see if they have an effective strikeout pitch(es).  You also want to view the mix of pitches used by the pitcher over time.  Finally, you wish to limit your research to the last two years of major league data (2012 and 2013 seasons, at the time of this article).

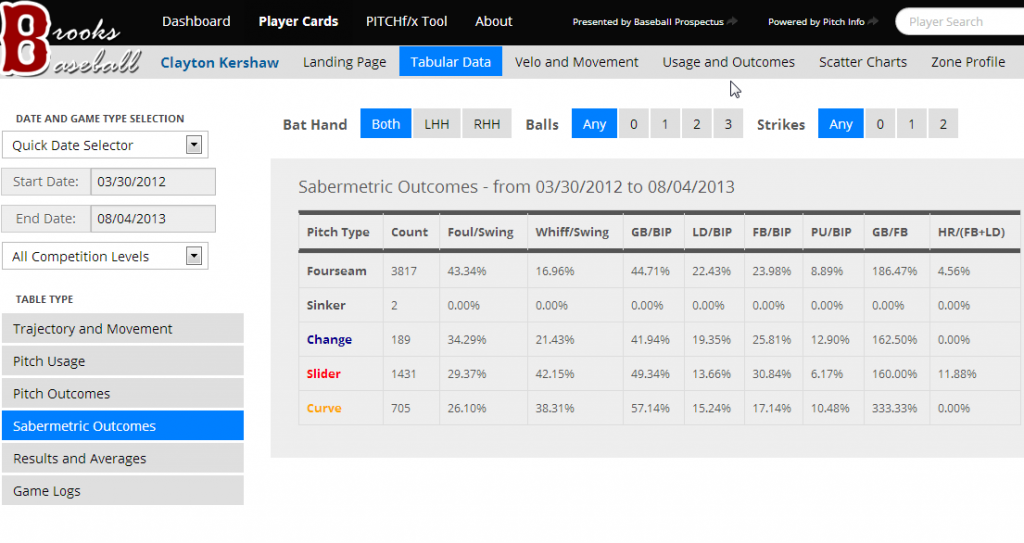
You visit BrooksBaseball.net and this example page below (for Clayton Kershaw) displays fly ball percentage, ground ball percentage, the number of pitches and times each has been thrown, and the whiff percentage for each pitch type over the last two years.

URL1

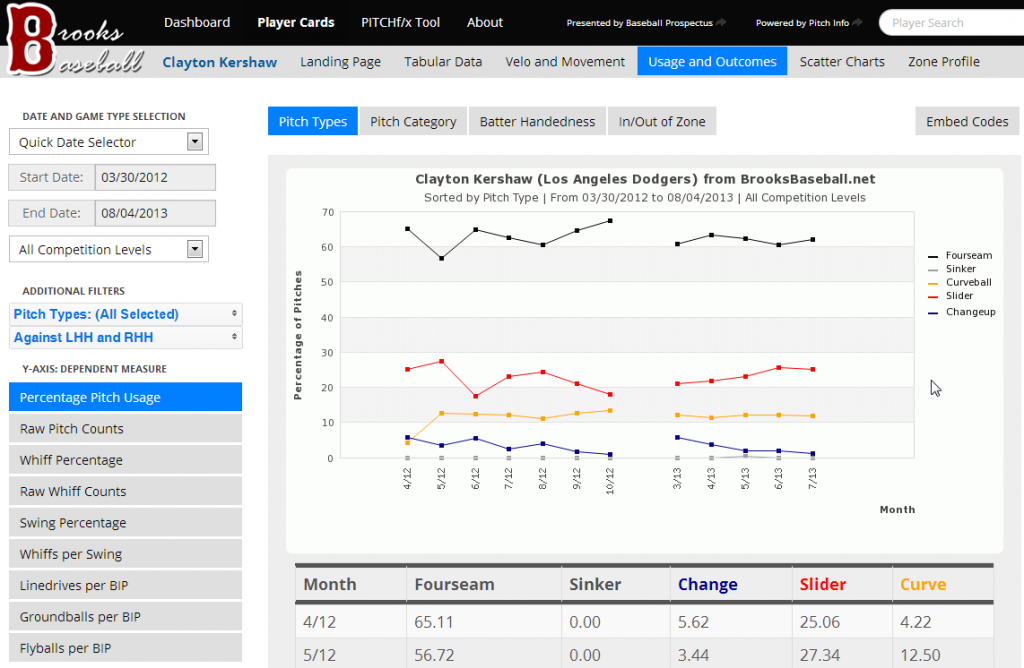
This example page shows you mix of pitches used, by month, over the last two years.

URL2

Between these two pages, we can do all the necessary research to make a decision about the free agent pitchers.

Looks At the URLs For Those Sites

The key to making this player research a more efficient process is to take advantage of the web address (URL) for these pages.  You can locate the web address for a web page by visiting the site and looking at the path shown at the top of your browser.

URL3

The image above is the URL for Kershaw’s “Tabular Data>Sabermetric Outcomes” page at BrooksBaseball.net.  The tail end of that URL has very important information embedded in it that we can use.

www.brooksbaseball.net/tabs.php?player=477132 &gFilt=&time=month&minmax=ci&var=so&s_type=2& endDate=08/04/2013&startDate=03/30/2012

The “player=477132” component of the URL specifies that this search/web page is for player ID 477132, or Clayton Kershaw.

The “endDate=08/04/2013&startDate=03/30/2012” component restricts the search to 2012 and 2013 season data (up to August 4, 2013, the time of writing).

Here’s the typed URL for the “Usage and Outcomes” page at BrooksBaseball.net:

www.brooksbaseball.net/outcome.php?player=477132 &gFilt=&time=month&startDate=03/30/2012&endDate=08/04/2013&s_type=2

The same concepts for player ID and dates apply.  We can now focus in on the bold red text which differentiates the actual type of page being visited.

A Quick Discussion On Player IDs

If you’re not familiar, there are a number of Player ID systems used to track the statistics of major league baseball players.  MLB.com, Fangraphs, and Baseball Reference all have their own player ID system.

Clayton Kershaw’s player IDs for these three systems are as follows:

ID System Player ID
MLB.com 477132
Fangraphs 2036
Baseball Reference kershcl01

Notice that the MLB.com ID for Kershaw is the same as the ID used at BrooksBaseball.net.  So we know that Brooks Baseball uses MLB.com Player IDs.

If you want to know more about Player IDs, look back to part two of the “Create Your Own Fantasy Baseball Rankings” series where we looked at Player IDs, what they are, and how to use them to your advantage when working with large sets of baseball data. Continue reading “Fun With URLs and Player IDs”

Case Study: Ron Shandler’s Monthly League

If you’re not familiar with the name Ron Shandler, he’s been a legendary figure in the game of fantasy baseball.  He was one of the first writers to begin applying sabermetric-type thinking to fantasy baseball, he created the LIMA plan, founded BaseballHQ.com, and started the Tout Wars expert league.

And He’s At It Again

Shandler is experimenting with a new monthly league format.  One of the big selling points of the format is the ability to draft (or select) a new team each month.  Giancarlo Stanton, Curtis Granderson, Troy Tulowitzki, or Matt Kemp ruining your season?  The monthly format alleviates those concerns.  Multiple “draft days” during the season?  Sign me up.  Find a happy medium between the luck of weekly head-to-head formats and the marathon of a 162-game rotisserie format?  Perfect.

The Rules

Because of the All-Star break the contest will span five weeks.  Rotisserie scoring.  Players are selected based on a salary cap system in which salaries are assigned based upon production during the season to this point.

  • 30-team league
  • 30-man rosters made of 23 active players and 7 reserves.
  • Traditional rotisserie rosters – 2 C, 1B, 3B, Corner IF, 2B, SS, Middle IF, 5 OF, UT, 9 pitchers
  • 7 reserves can be any position
  • Salary cap is $300 for all 30 players
  • Players can be owned by multiple teams
  • 4×4 rotisserie scoring with the offensive categories of HR, SB, OBP, Runs Produced (R+RBI-HR, subtracting out HR removes “double counting” of RBI and R that occur on a home run) and pitching categories of W, Sv+Hld, K, ERA
  • No free agent pickups
  • Intra-roster moves (reserve-to-active and active-to-reserve) can be made twice weekly

The Player List

If you’re interested, the list of player salaries can be viewed here.

Thinking Through The Strategy

Because of the 30-team format, punting any category seems out of the question.  Stress needs to be put on forming a balanced team.  Being unable to pick up free agents means your team has to be constructed to absorb injuries that may arise during the month.

The ability to make moves twice a week looks like an opportunity to implement a pitching strategy.  You can’t gain much of an advantage in games played offensively, but it seems like carrying additional pitchers would allow for squeezing out a few extra starts over the month.  Alternatively, if one were to carry extra relievers with Save and Hold opportunities, you could implement a strategy of going after the Sv+Hld category while still being competitive in K and ERA.

After reviewing the rules, my strategy was to focus on building an offense with positional flexibility (to minimize the hitters necessary on my roster) and then use a volume strategy for accumulating pitching stats (more pitchers = more K and more Wins or Sv+Hld).

Finding The Value

In looking through the list of players, a number of “values” jumped out.  Players that have been injured or severely underperformed to this point in the season have extremely low values (Aaron Hill, Hanley Ramirez, etc.).

Realizing this, I needed a way to ensure I could identify all of the valuable players.  Simply combing through the list of 500+ hitters and 500+ pitchers isn’t reasonable.  I would surely miss someone valuable.

Building a Projection Tool

I used many of the principles and tactics outlined in the “Create Your Own Rankings” series.   Continue reading “Case Study: Ron Shandler’s Monthly League”

Use PITCH f/x Data To Identify Potential Breakout Pitchers (Part III)

If you’ve made it to Part III in the search to identify potential breakout pitchers, congratulations.  If you missed them, you can find Part I here and Part II here.

Enough Talk, Where Is This List Of Potential Breakout Pitchers?

I’ve uploaded an Excel file to Microsoft Sky Drive.  You can edit, view, or download the file for your own uses.  It’s mostly the same data from the YouTube video, but I added a lot of bells and whistles.  A red cell indicates a pitch that has declined in use from 2012 to 2013.  A green cell indicates a pitch with more usage.  The color intensity indicates the magnitude of the change.  The links to the right take you directly to that specific player’s page on BrooksBaseball.net.

PitchClass14
Click on the image to be taken to the editable file (you can edit or download for your own use).

Disclaimer #1

Keep in mind, I started this analysis on June 24th, 2013.  So if you’re finding this information after that time, you may want to double-check the usage graphs for any pitcher you’re researching.  But I’ve tried to document the approach to doing this research in the video and other parts of this series.  You can perform this research at any time (it would be great if we could get monthly usage reports from Fangraphs, then we could do this in the offseason to identify pitchers who started to change their mix late in the season).

Disclaimer #2

You saw from Part II of this series that these changes in mix have to be taken with a grain of salt.  And even after you’ve verified that there is indeed a change in pitch mix, you still need to go review the effectiveness of the pitches being used more frequently.  I wish I could go through each of these pitchers and break them down for you.  But it’s just not practical (my two-year old and four-year old don’t find PITCH f/x research very entertaining).  Hopefully I’ve equipped you with the tools you need to go analyze these pitchers more closely.

For pitchers on your team, check them out.  If you’re thinking of picking up a free agent, check him out.  If your pitching staff is terrible and you need to find the next big ace, check them all out.

Conclusion

Granted, it’s a small sample size.  But I’ve done a deep look in this fashion for Edward Mujica, Max Scherzer, and Alexi Ogando.  And all show promising results.  There will certainly be pitchers that change their mix and it has little effect on their end results.  But this seems like a promising exercise.

PLEASE LET ME KNOW WHAT YOU THINK Or If You Have Questions

I realize this is quite involved.  It’s certainly more difficult than reading the weekly pickups columns that are out there.  But anyone can read those and snag players just as easily as you can.  This process will put you ahead of the curve, give you players to monitor, and give you first crack at picking them up.

Thanks and be smart.


Use PITCH f/x Data To Identify Potential Breakout Pitchers (Part II)

Picking up where we left off in the post “Use PITCH f/x Data to Identify Potential Breakout Pitchers“, now that we’ve identified the potential pitchers (link to pitchers with differences) who have added a new pitch or that have significantly adjusted their pitch usage mix in 2013, we need to determine if the new or more heavily used pitch is successful.

Before We Go Any Further

I think it’s important you read the article The Internet Cried A Little When You Wrote That On It, by Mike Fast (follow Mike on Twitter).  The whole article will be helpful if you’re trying to improve you understanding of PITCH f/x, but at least read bullet #1.

My takeaway from that piece is that significant changes in pitch mix, especially within the fastball classifications (FA, FT, FC, FS, SI), are most likely to be changes in the algorithm used to classify the pitch.

Take for instance, Jake Peavy.  The PITCH f/x data I downloaded from Fangraphs and manipulated to identify “potentially” new pitches, shows the following for Peavy:

PitchClass2

Interpreting that chart, from 2012 to 2013, the Fangraphs data shows a decrease in the fastball (FA) of 19.9% and increase in the two-seam fastball (FT) of 26.7%.  That sounds interesting on the surface, no?  Decrease one pitch 20% and increase another?

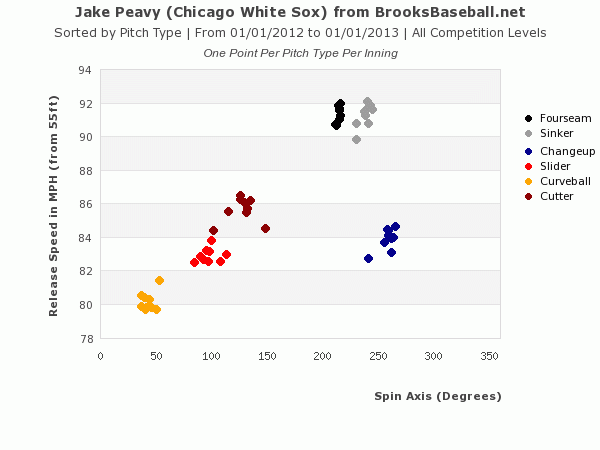
From Mike Fast’s article we know that we can’t necessarily trust the pitch classifications.  So let’s look at the 2012 velocity and spin on Peavy’s pitches:

PitchClass4
Click image to be taken to this page at BrooksBaseball.net

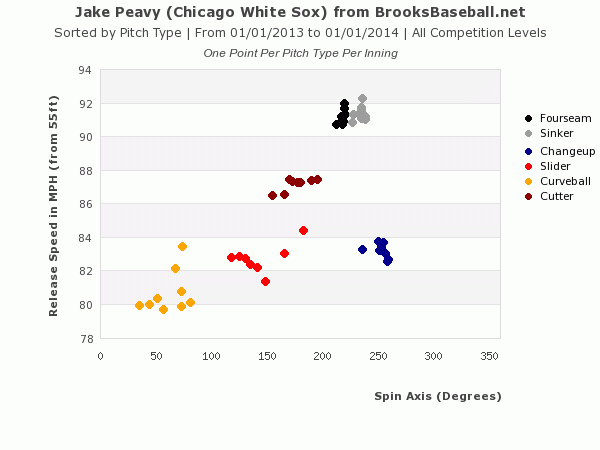
And the same for 2013:

PitchClass3
Click image to be taken to this page at BrooksBaseball.net

From these two charts you can see Peavy’s throwing the same pitches in 2013 that he was throwing in 2012.  The clusters are in the same general vicinity on the chart.  But more importantly, you can see there is very little difference between the fourseam (FA) and the sinker (BrooksBaseball calls the two-seam fastball a sinker (FT)).     So a 20% transfer from one classification to another is likely a change in the algorithm, as we were warned.

Give Me Someone Else to Look At

Alright, Alexi Ogando, although injured recently, has been intriguing.  The raw data shows a sharp decline in fastball usage and an increase in the changeup.  This probably isn’t just a case of an algorithm change (fastballs wouldn’t likely be misclassified as changeups).

PitchClass10

Let’s look at his 2012: Continue reading “Use PITCH f/x Data To Identify Potential Breakout Pitchers (Part II)”

Video: Use PITCH f/x Data To Identify Potential Breakout Pitchers (Part I)

I’ve talked before about the amazing tool we have at our fingertips in PITCH f/x.  I’ve also had two (Scherzer and Mujica) instances this season where I came across seemingly small anecdotes about a specific pitcher adding a new pitch, and the pitcher in question has gone on to have a “breakout” season thus far.  So I thought to myself…

Why Not Look For More Pitchers Who’ve Added A New Pitch

And rather than just share the results with you, I thought it might be more beneficial to share the method I used to do my search.  You know, the whole “teach a man to fish” proverb.

While there is a lot of great PITCH f/x data available at sites like Fangraphs and BrooksBaseball.net, I have not been able to locate a resource that allows me to do a year-to-year comparison of the data across a large pool of players (BrooksBaseball can show you great comparisons for a specific player).  So to identify these pitchers who have developed a new pitch, I had to download sets of data for 2012 and 2013 and apply some functions in Microsoft Excel.

I recognize that some of my posts get a bit lengthy and this process may have pushed the limits, so I’m trying something new and have put together my first YouTube video (if you’re interested in being notified of future videos, click here to subscribe to the SFBB YouTube channel).

About The Video

The video is approximately 15 minutes long, and takes you through a step-by-step process to download PITCH f/x pitch usage data from Fangraphs.com, pull the data into Excel, match up 2012 and 2013 pitch usages, calculate a difference in pitch usage, use the calculated difference to target players that are most likely throwing a new pitch in 2013, and how to use BrooksBaseball.net to conduct further research on individual pitchers.

Coming Soon

I’ll polish up the results and post an Excel file, containing pitchers to keep an eye on, for you to analyze.

Thanks for reading… and watching.  Stay smart.