Welcome to Part I of a three-part series in which I’ll share an improved method of determining standings gain points factors. In this first part I’ll show graphically demonstrate the old method I used in calculating SGP factors and compare it to the improved method.
I’m mostly self-taught when it comes to my knowledge of standings gain points. It’s hard to say where I picked up the information. I think it’s an accumulation of information gleaned from message boards and old web sites. Nevertheless, I continue to learn and I recently came across an improved method of calculating SGP factors.
Enter Art McGee
Art McGee published his approach to using standings gain points in his book, How to Value Players for Rotisserie Baseball. The book was originally published in 1997 and he put out an updated version in 2007. So his theories have been around for quite some time and continue to live on. The Excel implementation of SGPs that I use has been tweaked some, but is very consistent with McGee’s approach.
NOTE: I have provided an affiliate link (what’s an affiliate link?) to the book on Amazon to the right, but at the time of writing, I don’t suggest you buy it from Amazon. It seems like the book is difficult to come by and the prices are quite high. The link is just so you can see the book and read the summary, or maybe the prices will come down in the future. If you do want to purchase McGee’s book, Baseball HQ is selling them on a close out sale for $8.95 plus S&H. That’s where I got my copy.
A Difference Is Found
Not too far into McGee’s explanation did I come across an important difference in the way he calculates his SGP factors. To illustrate the difference, let’s take a look the following sets of Home Run standings:
| Rotisserie Points | HR Data Set #1 | HR Data Set #2 |
|---|---|---|
| 12 | 291 | 300 |
| 11 | 287 | 273 |
| 10 | 281 | 260 |
| 9 | 274 | 249 |
| 8 | 272 | 249 |
| 7 | 267 | 248 |
| 6 | 263 | 243 |
| 5 | 261 | 241 |
| 4 | 244 | 231 |
| 3 | 239 | 231 |
| 2 | 234 | 229 |
| 1 | 191 | 203 |
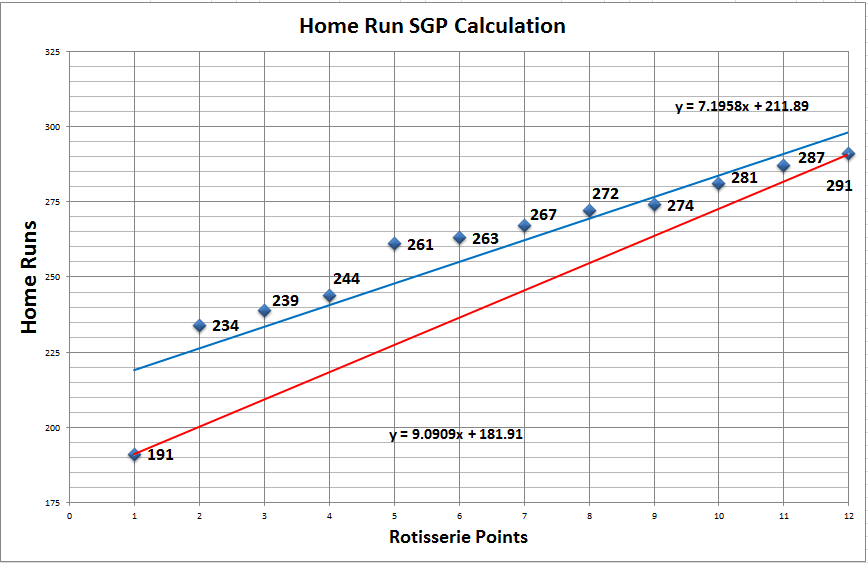
I previously would have calculated my SGP factor for “HR Data Set #1” as the first place value (291) less the last place value (191), divided by the number of teams that could be passed (in a 12-team league you pass 11 teams by going from worst to first). Specifically the SGP for Data Set #1 is 9.0909 ((291-191)/11) and for Data Set #2 is 8.8182 ((300-203)/11).
Let’s Plot It Out
The red line below plots out the approach I have been using to calculate my SGP factors. If you think back to high school math class, we’re really calculating the slope of the line here. Notice how the 9.0909 I calculated above matches the slope in the formula representing the red line, y = 9.0909x + 181.91.
And when you look at the red line next to the other plotted data points, you see that it doesn’t do a great job of fitting data as a whole. This is the weakness in only using the highest and lowest data points to approximate the number of home runs necessary to move up one point in the standings.
 Continue reading “Improved SGP Calculation Formula – Part I”




 And the accumulated team stat totals are at the bottom.

 Or use the buttons below if you'd like to purchase the guide now for $9.99.

 I’m very happy to announce that I’ve just finished the “missing pieces” to the “Create Your Own Fantasy Baseball Rankings” guide.