How To Evaluate a Trade Using Standings Gain Points

In this video I’ll show you how to add a Trade Evaluator into your existing rankings spreadsheet.

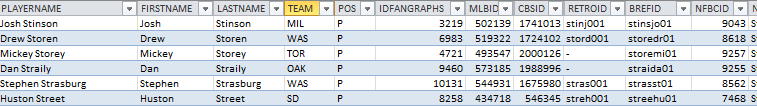
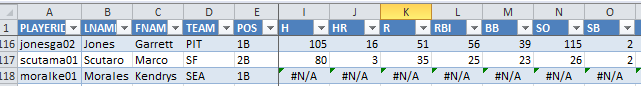
Here’s an animated image demonstrating the finished product.  This spreadsheet will pull in all the Rest of Season projections for a player, their total SGP to be earned the rest of the season, and the player’s dollar value (provided you’ve added dollar value calculations to your sheets).

TradeEvaluator

I’ll also show you a practical example and explain a few important things to think about when considering trade offers.

The video is roughly 30 minutes long, but keep in mind that just about everything you create by following the guides on this site are long-term in nature.  With a little bit of maintenance, all of these tools can be used all season long AND into future seasons.

The Step-By-Step Process

I start with a spreadsheet that has already been updated with RoS Projections.  I then show you how to add a tab just to evaluate trades and other roster decisions.  We’ll add drop down menus that pull each player’s statistics, dollar value, and SGPs.

This information will enable you to add clarity to all your roster moves.  No more using your gut to analyze a 2-for-3 player trade involving hitters and pitchers.  You’ll be able to see exactly which side of the offer is better.

If you’re new to the site, I would suggest getting familiar with How To Create Your Rankings Using Standings Gain Points.

A Quick Suggestion

WatchVideoDoubleSpeed
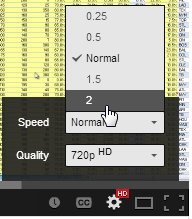
If you’re looking for a way speed things up by watching them 1.5 or 2 (double)  speed, cutting down the time it takes to watch significantly.  Just adjust the settings at the bottom of the video player.  Click the cog and change the “Speed to 1.5 or 2.

I also recommend watching the videos in HD.  A lot of the detail in Excel can only be seen well in 720p or higher.

And a Disclaimer

I created this video using Prince Fielder, Jose Abreu, Billy Hamilton, and Ian Kinsler in an example trade.  News that Fielder is facing season-ending surgery came out the next day!  I apologize for this glaring problem with the example, but hope you can still see the power of using a tool like this to evaluate trades and free agency acquisitions.

Here’s The Video

Thanks for Watching

Stay smart.

Questions?  Comments?  Future Video Ideas?

Let me know in the comments below.

How To Use SGP To Rank and Value Players During the Season – Part 6 – Adjust Replacement Level

Welcome to the final part of the series in which we go through the process of plugging Steamer’s Rest of Season (RoS) projections into your existing ranking/dollar value spreadsheet so you can make informed and objective roster decisions during the season.

If you register as an SFBB Insider (it’s free), you can receive the entire series in an easy-to-use e-book (also free) along with two other helpful guides.  I’ve also written a comprehensive guide on ranking players and calculating player dollar values that’s available at Amazon.

Introduction

In this sixth part of the series we will revisit the concept of replacement level and adjust replacement level for our updated RoS projections.

Reminders About Replacement Level

If you’re new to the concept of replacement level read the introduction here (don’t go into the “Step-by-Step Instructions”.  When you consider the injuries that occur in Major League Baseball, rookies being called up, players underperforming projections, and others exceeding projections, the player pool is constantly changing.

In order to make the best possible decisions and to calculate representative dollar values, it is very important that we update the estimate of replacement level.

Caution:  No Further Adjustments Necessary

When listening or reading fantasy advice, you might come across a piece of advice that goes something like this, “You really need to draft a SS early to account for the lack of depth at the position.  Go ahead and reach for that shortstop.”

Don’t listen to that advice when you’re using the approach we’re now going through.  The replacement level adjustment that follows is already calculating the effect of depth at each position.  And it does it mathematically.  There is no guesswork going on here.

DON’T MAKE ANOTHER ADJUSTMENT.

You do not need to make an arbitrary adjustment to shortstops or catchers, or any other position.  When you have added this adjustment to your rankings, each player will be ranked according the their value over the worst players at the position.  If the position is weak, that’s accounted for.  If the position is deep, it’s accounted for.

If you then decide to make arbitrary adjustments to your rankings after adding in the replacement level calculation, YOU ARE DOUBLE COUNTING.

You will be reaching for players and you will be hurting your team.  Don’t “bump” players up a list because of their position.

Step-By-Step Instructions

Continue reading “How To Use SGP To Rank and Value Players During the Season – Part 6 – Adjust Replacement Level”

How To Use SGP To Rank and Value Players During the Season – Part 5 – Update the Player ID Map

Welcome to the fifth part in a series of posts in which I’ll go through the process of plugging Steamer’s Rest of Season (RoS) projections into your existing ranking/dollar value spreadsheet so you can make informed and objective roster decisions during the season.

If you register as an SFBB Insider (it’s free), you can receive the entire series in an easy-to-use e-book (also free) along with two other helpful guides. I’ve also written a comprehensive guide on ranking players and calculating player dollar values that’s available at Amazon.

Introduction

In this fifth part of the series we discuss updating the Player ID Map to pull new players into the rankings information.

Player ID Map

The SFBB Player ID Map contains the Fangraphs, MLB, Baseball-Reference, Retrosheet, CBS, NFBC, ESPN, Baseball Prospectus, Davenport, and Yahoo player IDs for over 1,200 players.  It’s not a comprehensive list of past players by any means, but I make a concerted effort to have all current fantasy-relevant MLB players and those minor league players likely to make a fantasy impact this season.

PlayerIDMap

To give credit where credit is due, I originally downloaded the player map from Crunchtimebaseball.com and tailored it to meet my needs.  CrunchTimeBaseball is run by Tim Blaker.  He continues to maintain his own map of player IDs and generally keeps his more up-to-date than I do.  You can obtain his version here.

Why Update the Player ID Map

April inevitably brings us players that were never intended to be fantasy relevant; minor leaguers that were not anticipated to make the jump, role players thrust into starting jobs, and more.  As the summer rolls on, impact rookies begin to get called up that may not have been in the preseason Player ID Map.  When September arrives there will be more of the same.

While it is possible to add individual players to the player ID map, it can be inefficient to add more than a handful.  Updating the entire list is probably easier.

Step-By-Step Instructions

Continue reading “How To Use SGP To Rank and Value Players During the Season – Part 5 – Update the Player ID Map”

How To Use SGP To Rank and Value Players During the Season – Part 4 – Add the IFERROR Formula

Welcome to the fourth part in a series of posts in which I’ll go through the process of plugging Steamer’s Rest of Season (RoS) projections into your existing ranking/dollar value spreadsheet so you can make informed and objective roster decisions during the season.

If you register as an SFBB Insider (it’s free), you can receive the entire series in an easy-to-use e-book (also free) along with two other helpful guides. I’ve also written a comprehensive guide on ranking players and calculating player dollar values that’s available at Amazon.

Introduction

In the fourth part of the series we’ll introduce a new Excel formula to help remove lookup errors, like those shown above, from our spreadsheets.  These occur when we have instructed Excel to do a VLOOKUP to find a player’s RoS projections and Excel is unable to find the player ID within the projection data.

Often times a player will stop appearing in the RoS projections.  This might be because they’ve suffered a season-ending injury, they’ve retired, or they’re an unsigned free agent. If that player remains in the list of hitters or pitchers rankings, no projection can be found for that player.  I’ve realized that the rankings and dollar value formulas I previously used did not handle these situations very well, so it’s necessary to adjust these formulas slightly.

Adding this formula to your spreadsheet is a one-time fix.  You won’t need to go through this part when you download updated RoS projections in the future.

Excel Functions in Part 4

IFERROR

The IFFERROR function allows us to control what happens when another function being used is calculating an error.  The image below is a great example of this.  On our “Hitter Ranks” tab we have a series of VLOOKUP formulas that instruct excel to go find Kendrys Morales’ player ID (moralke01) in the “Steamer Projections” tab.  During the 2014 season Morales is likely not included in the RoS projections because he remains unsigned by any Major League team.

IFERROR-Excel-Formula

The IFFERROR function will allow us to replace the error message with any value of our choice.  It essentially works by telling Excel, “If this other formula I’m using comes back with an error, use this instead”.

The formula requires two inputs:

IFERROR(value,value_if_error)

  1. Value – This represents the formula or calculation we want Excel to perform.  In our example above it will be the same VLOOKUP formula we already have entered.
  2. Value_if_error – This represents the value or message we want Excel to return if the first argument, “Value”, returns an error.  In our example above we don’t want the default “#N/A” error message that turns up if Excel cannot locate Kendrys Morales in the RoS projections.  Instead, we could just ask for Excel to return zeroes for his projected stats.

Step-By-Step Instructions

Continue reading “How To Use SGP To Rank and Value Players During the Season – Part 4 – Add the IFERROR Formula”

How To Use SGP To Rank and Value Players During the Season – Part 3 – Delete Old Info and Insert New RoS Projections

Welcome to the third part in a series of posts in which I’ll go through the process of plugging Steamer’s Rest of Season (RoS) projections into your existing ranking/dollar value spreadsheet so you can make informed and objective roster decisions during the season.

If you register as an SFBB Insider (it’s free), you can receive the entire series in an easy-to-use e-book (also free) along with two other helpful guides. I’ve also written a comprehensive guide on ranking players and calculating player dollar values that’s available at Amazon.

Introduction

In this third part of the series we will remove the old (preseason) projections from our spreadsheet and paste in the new information.  It sounds simple, but there are a few tricks to be aware of.

Step-By-Step Instructions

Continue reading “How To Use SGP To Rank and Value Players During the Season – Part 3 – Delete Old Info and Insert New RoS Projections”

How To Use SGP To Rank and Value Players During the Season – Part 2 – Download and Prepare Rest of Season Projections

Welcome to the second part in a series of posts in which I’ll go through the process of plugging Steamer’s Rest of Season (RoS) projections into your existing ranking/dollar value spreadsheet so you can make informed and objective roster decisions during the season.

If you register as an SFBB Insider (it’s free), you can receive the entire series in an easy-to-use e-book (also free) along with two other helpful guides. I’ve also written a comprehensive guide on ranking players and calculating player dollar values that’s available at Amazon.

Introduction

In the second part of the series we will download the free Rest of Season Steamer projections that are available from Fangraphs.com.

Step-by-Step Instructions

Step Description
1. Visit Fangraphs’ Steamer RoS projections at this link or visit Fangraphs.com and hover over the “Projections” link on the menu bar and look for “Steamer (RoS)”.Fangraphs2
2. Once the page loads, use the link to “Export Data”.Fangraphs-RoS-Export
3. The data will download in CSV (comma separated value) format. Locate the downloaded CSV file and open it.

It should open in Microsoft Excel (if it doesn’t, launch Excel and then use the File>Open menu to open the CSV file).

You might recall from our earlier work that theFangraphs reports come withPlayerID as the last column in the file. We must move thisto be the first column so we can later use the VLOOKUP formula to pull data from theseRoS projections.Once the file opens, locate the “playerid” column. Right-click on the column header (column “W” in the image below) and choose to Cut the column.Cut_Fangraphs_ID

4. Now right-click on the first column header and choose the option to “Insert Cut Cells”.Insert_Fangraphs_ID
5. Repeat the steps above for pitchers. You can obtain RoS Steamer pitcher projections here or by clicking the “Pitchers” button at the top of the Steamer hitters web page.Steamer_RoS_Pitchers

The “playerID” column is currently column “S” in the Steamer RoS download.Excel-ROS-Projection-Part2-6

6. You have finished reordering the information and have copied it so it can be pasted into your rankings and dollar value calculation spreadsheet.

Example Excel File

We did not edit the main dollar value calculation spreadsheet in this part, so no example spreadsheet is provided.

Questions?

Do you have questions about Part 2? Or want to see what others have asked? Comment below.

How To Use SGP To Rank and Value Players During the Season – Part 1 – Introduction to Rest of Season Projections

Welcome to the first part in a series of posts in which I’ll go through the process of plugging Steamer’s Rest of Season (RoS) projections into your existing ranking/dollar value spreadsheet so you can make informed and objective roster decisions during the season.

A few notes about the series:

Let’s Get Started

If you’re a frequent reader of this site, hopefully you spent the offseason toiling over a spreadsheet making projections, developing rankings, and calculating dollar values.

That dynamite spreadsheet you created has probably been sitting on the shelf for the last month accumulating dust.  But did you know you can still use it to make informed in-season roster decisions?

I’ll show you how in a second.

Avoid This Scenario

Once the season starts, we immediately become retrospective in our decision making. You navigate out to the free agent listing and you see the stats players have accumulated to date.  Some utility infielder with a .240 career average is sitting there staring at you with 5 HR and a .386 batting average to start the season.

This is bad.  We don’t draft based on last season’s stats, so why should we make current roster decisions about last week’s stats?

As we do during the draft, we should be making roster decisions based on projected or future performances.

Some sites do offer full season projections.  They are helpful, but they become less meaningful as the season progresses.  Full season projections are likely not being updated, and we don’t care about the stats that someone has already earned.

What we really want are rest of season projections.  Or what a player is going to do from here on out.

How To Obtain Rest Of Season (RoS) Projections

Continue reading “How To Use SGP To Rank and Value Players During the Season – Part 1 – Introduction to Rest of Season Projections”

In Season Player ID Map Update

I’m preparing to roll out another resource that will hopefully help bring clarity to your in-season moves (I think it’s going to be big!).  In preparation for this, I’ve gone through and done a Player ID Map update to include players that have recently become “fantasy-relevant”, in my mind.

You can download the updated map here.

A complete list of changes can be found in the “Change Log” tab of the spreadsheet.

ESPN_Player_ID

Some of the more notable additions to are:

If you’re new to the site, consider checking out these past posts that illustrate some interesting things you can do with player IDs.

Please let me know if I’ve missed anyone.  Stay smart.

Improved SGP Calculation Formula – Part III

Welcome to the final of a three-part series in which we take a closer look at an improved method of determining standings gain points factors.  In the first part of the series we looked at the difference between my old method of calculating standings gain points factors and the improved approach suggested by Art McGee in his book, How to Value Players for Rotisserie Baseball.  In the second part of the series we looked at how to implement the SLOPE function in Microsoft Excel.

In this final part of the series we take a closer look at how these SGP changes affect the end rankings.

Old Vs. New

As I alluded to in part two, I’ve been tracking the standings history (link to view Excel file) for my favorite league for several years and I use this history to calculate my SGP factors.  Here’s a summary of the factors calculated under my old approach stacked up against the factors as calculated by the SLOPE function suggested by Art McGee in How to Value Players for Rotisserie Baseball.

Stat Old Approach SLOPE Approach % Change
BA 0.00184 0.00169 -8.15%
HR 9.63059 8.87013 -7.90%
R 24.82973 22.02314 -11.30%
RBI 25.05772 22.30803 -10.97%
SB 10.00577 8.18620 -18.19%
ERA -0.10587 -0.08817 -16.72%
K 35.14141 31.6227 -10.01%
SV 6.41558 5.69641 -11.21%
W 3.34776 2.95793 -11.64%
WHIP -0.01788 -0.01518 -15.10%

Continue reading “Improved SGP Calculation Formula – Part III”

Improved SGP Calculation Formula – Part II

Welcome to Part II of a three-part series in which I’ll share an improved method of determining standings gain points factors.  In the first part of the series we looked at the difference between my old method of calculating standings gain points factors and the improved approach suggested by Art McGee in his book, How to Value Players for Rotisserie Baseball.  

In this part of the series I’ll explain how to implement the SLOPE function McGee suggests.

The SLOPE Function

The SLOPE function interprets a set of data points and returns the slope of the linear line-of-best-fit for the data. The function requires two inputs:

  1. The Y-values of all the data points
  2. The X-values of all the data points

Again, we’re back in high school math class (or earlier?).  The Y-values (vertical axis) will be the actual accumulated statistics for each team in the league for the category we’re measuring.

The X-values (horizontal axis) will be the rotisserie points earned for each team.

For example:

Rotisserie Points (x-values) Home Runs (y-values)
12 291
11 287
10 281
9 274
8 272
7 267
6 263
5 261
4 244
3 239
2 234
1 191

Let’s Put This Into Excel

You can see the data entered into Excel below.

Given this exact set of data, the formula used in Excel to calculate the slope is:

=SLOPE(B2:B13,A2:A13)

A More Comprehensive Example

This is only the home run data for one season for one league.  In order to calculate more accurate SGP factors we should be including multiple years and/or leagues and we also need to perform these calculations for many different statistics (not just home runs).

A more thorough example Excel file that contains several years of data and the SLOPE calculations for the different years can be found below.  It’s not my prettiest work, but this is a file you only need to be in once a year, when you’re updating your SGP calculations for an upcoming season.  You can download the file using the ExcelWebApp toolbar below the spreadsheet.

WHAT’S COMING?

In the final part of the series I’ll take a deep dive into how these changes in SGP calculations affect our end rankings.

Want More In-Depth Analysis Like This?


Thanks For Reading

Stay smart.