Sabermetrics
The Problem With Batting Average
- One problem with batting average is the different basis between AB and PA
- The currency of baseball is RUNS. In the end, that’s all that matters.
- One of our goals needs to be determining how well a stat (like BA) relates to runs scored.
- There is a nice linear relationship between Team BA and Team Runs Scored.
- R^2 is about 0.67
- 67% of the variation in runs scored by a team is explained by BA
- This is determined by running a two variable analysis (bivariate). Plot team runs cored on the x-axis and team batting average on the y-axis.
- “League Factor” or “Run scoring environment” is a time when run scoring environment might be high due to steroids or juiced baseballs. Likewise, run scoring could be down in a certain era, etc.
- Batting average treats a HR the same as a single, so that implies we can do better than just looking at batting average. It also doesn’t measure the ability to get on base.
- Our ultimate weapon in scoring runs is a measure that includes the ability to get on base and power
- Various corellations
- BA – 67%
- HR – 55.7%
- H – 66%
- OBP – 77.9% ((H+BB+HBP)/(AB+BB+HBP+SF)
- SLG – 82.3% ((1B+2*2B+3*3B+4*HR)/AB)
- OPS – 89.3% (OBP + SLG)
- RC (runs created) ((H+BB)*TB/(AB+BB) – 92.3%
Measures of Spread In a Data Set
- Range – largest number in a data set minus the smallest
- Interquartile range (IQR) =Q3 – Q1
- NOTE: If the median is the average of two numbers (you have an even number of data points), you include the two numbers in your determination of Q3 and Q1
- Five Number Set
- S – Smallest
- Q1 – Median between S and Q2
- Q2 – Median
- Q3 – Median between Q2 and L
- L – Largest
- Percentile – example, if you want to determine the 90th percentile, take 0.9 * n, then round up. If you have 17 data points, 0.9 * 17 = 15.3, round up to 16
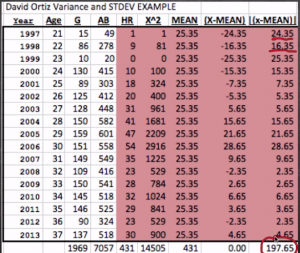
- Average Absolute Deviation (S^2, S squared) – calculated by taking the absolute value of the difference of each data point from the mean. The sum of all the differences from the mean is then divided by the number of data points (n)

- Variance, Standard Deviation (SD, S, σ)
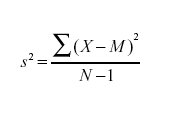
- Variance – Each data point, minus the mean, squared. Divide that by size of the data set minus 1.

- Standard Deviation is the square root of the variance
- Coefficient of Variation (CV) – way to compare data sets, a dimensionless variable. There are no units to the measure.
- CV = S / X
- Or standard deviation divided by the mean
The Shape of Data, Distributions
- Histogram
- X-axis is different bins of data
- Y-axis is frequency/counts of the occurrences
- Normal Distribution (classic, symmetrical)
- Mean, median, mode are all very close to the center of the data
- Shape of data affects where the mean, median, mode show up
- Skewed right – data set is tightly grouped to the left of the mean, mean is typically greater than the median
- Skewed left – data set is tightly grouped to the right of the mean is typically less than the median
Statistics
- Descriptive statistics
- Collection
- Organization
- Presentation
- Summarization
- Measures of central tendency
- Mean (average)
- Median
- Mode
- Spread of data
- Shape of data, distribution
- n = number of records, data points
- Σx = Sum of all data points (that’s a sub x)
- Average (symbol for this is x with a bar over it) = Sum of all data points / n
- Median = rank order the data set, then the middle point is the median
- Mode = most common number in the data set
Computer Science & Technology
- SQL reference at W3 Schools
- Can comment out in SQL using #
- SELECT columns and/or expressions FROM tables WHERE conditions, ORDER BY (to sort output);
SELECT
- Can use * (to list all columns), list specific field names, or use expressions (calculated statements)
- Example of an expression would be A + PO + E from the Fielding table to calculate “Total Chances”
- SELECT DISTINCT POS – returns the list of all unique values from the column
Nested Select
- You can nest a select clause inside a larger clause
- This is called an “internal select”
- Embed it in parentheses for neatness
- Can do this to answer a question like “What players had more HR than Mike Trout in 2013?”. You would run an internal select to calculate how many HR Mike Trout had in 2013 (SELECT HR FROM Batting WHERE playerID=’troutmi01′ AND yearID=2013). Then put this in your “HAVING” or “WHERE” clause in your larger query.
SQL Aliasing
- A + PO + E AS TotalChances
- Can also Alias a column name/field
- CANNOT use an alias in an expression, must use real field name
- Everything in the SELECT statement must be a field name
WHERE
- If doing a WHERE clause on text, need to surround with quotation marks
- If doing a WHERE clause on numeric values, do not need to
CONDITIONS
- fields>operator>value
- Operators
- = (equal to)
- != (not equal)
- > (greater than)
- >= (greater than or equal to)
- < (less than)
- <= (less than or equal to)
- AND (both conditions are met)
- OR (either condition is met)
ORDER BY
- To sort output
- You do use aliases when giving the ORDER BY statement because you’re ordering the output, not selecting from a table
- ORDER BY output column name DESC/ASC
Aggregate functions
- Perform a calculation across many rows and return a single calculation value
- SELECT followed by one of these aggregate functions:
- AVG(A) AS AVG_XXXX
- COUNT(A) AS COUNT_XXXX
- COUNT(DISTINCT A) AS COUNT_DISTINCT_XXX
- SUM(A) AS SUM_XXXX
- MIN(A) AS MIN_XXXX
- MAX(A) AS MAX_XXXX
- STDDEV(A) AS STD_XXXX
- VARIANCE(A) AS VAR_XXXX
Group By
- Controls how the aggregate functions are summarized multiple lines into one
- GROUP BY Field1, Field2 will apply these two conditions
- For example, GROUP BY teamID, yearID will calculate aggregates for each team by year
Having
- Works with aggregate functions
- Follows a GROUP BY clause
- Essentially allows you to put a WHERE clause on the aggregate information or on ALIASES
- For example, the databases don’t contain OBP. If you want to apply a filter/WHERE clause on OBP>.400, you need to use HAVING (because it’s an alias)
Limiting Results Returned
- At the end of entire SQL statement add LIMIT ###; and only that number of records will be returned
History
Hugh Fullerton
- Observed, studied, and recorded the games
- But he also analyzed the game and tried to model it
- Predicted the White Sox would win the World Series in 1906, but the thought was so outlandish that his editor refused to run the article. The Sox won the series though, and the article was printed after the fact.
- Did early pitcher clustering to see how batters performed against certain types of pitchers
- He looked at park effects
- Wrote an article predicting the Yankees would win 8 more games when they acquired Babe Ruth
- Did work that led him to question the legitimacy of some of the actions of the White Sox in the Black Sox scandal. He was very important in this scandal.
- Took Ruth to Columbia University to have him tested on scientific measures
- Ruth had superior reaction time
- Superior hand-eye coordination
- Superior mental acuity
- The Physics of Baseball
- About the science of curving a baseball
- Proved that a ball could curve up to 17″
- “Chances of Things”
- Used his own play-by-play data that he recorded (158 games)
- How many/what percent of runners get to 1st, 2nd, 3rd, Home
- 974 runs scored out of 3,913 runners that got to first (25% scored)
- Looks at sacrifices and the value of them (64% success rate)
- Stolen bases
- Squeeze plays
- Slashing play (hit and run, 58%, and if it didn’t work it was often a double play)
- Noted that stealing 3rd (62%) was more successful than 2nd (55%)
- He also began charting defensive player range and positioning
- Also began tracking BA by type of ball in play.
We use cookies to ensure that we give you the best experience on our website. If you continue to use this site we will assume that you are happy with it.Ok


