***UPDATED for the 2024 Season***
What is the Projection Aggregator?
The Projection Aggregator is an easy to use Excel spreadsheet that can combine (or average) up to three different projection sets to give you the best possible set of projections to use for the upcoming season. You can use just about any well known projection source you have at your disposal. Download your favorite projections, fill out the settings tab shown below (instructions included), and you’re done.
No complicated formulas. No VLOOKUPs. Just download projections, bring them in to the Aggregator, and fill out the settings below. That’s it! You’ll have better projections in minutes.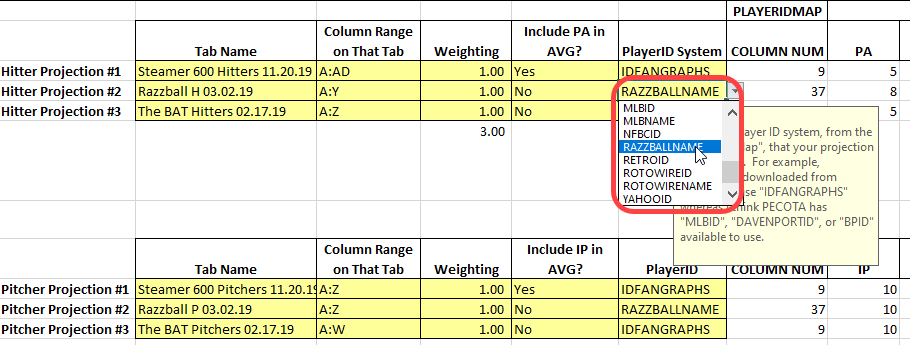
Keep reading to find out more or click the “Add to Cart” button below to check out safely using your PayPal account.
Buy the Projection Aggregator for $9.99…


Can Averaging Projections Really Increase their Accuracy?
If you found your way to this page then it’s pretty likely that you’ve heard this argument at some point in your fantasy baseball career,
“Never average multiple projections together. All that does is take away any advantage you have. It’ll eliminate all the sleepers and bust players from the list and you’ll end up losing to the other teams that go out on a limb and are aggressive. The only way to get an advantage is to choose one system you trust. Don’t downgrade it by averaging in something else.”
I’m paraphrasing, but we’ve probably all read something like that on a message board at some point in time.
I thought that argument had merit.
But the more I have looked into it I’ve realized that it’s pretty much an agreed upon fact by the forecasting community that your default behavior should be to combine multiple forecasts to get the most accurate result (that’s what baseball projections are). Go Google, “Should you combine multiple forecasts” and scan through some of the top results if you don’t believe me.
We don’t know what’s going to happen. Projections systems don’t know. But what we have are a lot of smart people who develop their projections in different manners. And that’s where the value lies. That’s the best time to combine different projections, when you have multiple intelligent and proven systems attacking the problem differently.
The only time it makes sense to rely upon one system is when you very clearly know that system is superior to all the others… And we don’t know that for baseball.
What Features Does This Spreadsheet Have?
I think its best feature is that I designed it to be easy to use and I include a short 12 page instruction guide to make sure everything is crystal clear (the guide has a lot of big pictures and big font, it’s not long at all). I’ve had quite a few readers of the site test the file out and they all thought it was easy to use. It’s been tested quite thoroughly!
If you’re looking for more specific features:
Easily Use Many of the Common Projection Sets
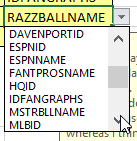
The Projection Aggregator is preloaded with the SFBB Player ID Map which will allow it to work with nearly all of the popular projection systems (I’m not aware of any popular system it won’t work with). It can easily work with projections from Fangraphs, Baseball Prospectus, Baseball HQ, Mastersball, CBS, and more. It does NOT come with these projections, but if you have access to premium projections from a major fantasy service provider, the Projection Aggregator can likely work with them.
What Projection Systems Does This Work With?
Here are some of the projection systems the Aggregator will work well with:
- Steamer (free at Fangraphs)
- Zips (free at Fangraphs)
- PECOTA (premium at Baseball Prospectus)
- Mastersball (premium at Mastersball)
- Baseball HQ (premium at Baseball HQ)
- Fantasy Pros (free at FantasyPros)>
However, this is not a comprehensive list because the Aggregator will work with any projection system that uses Player IDs (read more about player IDs here) from Fangraphs, Baseball-Reference, Baseball Prospectus, Davenport, MLB, ESPN, CBS, or Yahoo.
Several of the sites mentioned above (ESPN, CBS, Yahoo) do not provide downloadable projections that contain the player ID that is ideal for the Aggregator to work, but with a little bit of homework on your part you can get the Player ID’s necessary.
Equal or Custom Weighting
You can choose to include all projection sets in the average at equal weight. Or if you have a favorite system or have evidence that one has historically been more accurate than others, you can give that system more weight in the averaging.
Enter Your Own Playing Time for Any Player
A lot of projection systems don’t take current events and depth chart information into account when developing their projections. If there is any area of projecting baseball statistics that I think I can beat a computer at, it’s playing time. The Projection Aggregator allows you to override any individual player’s plate appearances (or innings pitched) and enter your own estimate. That playing time estimate that you enter is then multiplied by the averaged rates for the player. For example, if the aggregate projections say project a player for 50 runs and 300 plate appearances but you believe he’ll be a full-time 600 plate appearance player, the Projection Aggregator will update the players run estimate to 100 runs.
This is especially helpful for making last minute adjustments to player projections as your draft approaches. If a pitcher comes down with an elbow injury you can immediately drop his IP to zero. If a player has a hamstring injury late in the preseason and will miss six weeks, you can drop his PA projection to account for that. 
Compare Multiple Hitters and Pitchers to Each Other
You can see up to four hitters side-by-side and see their stat line for each of the projection systems you’ve brought into the file.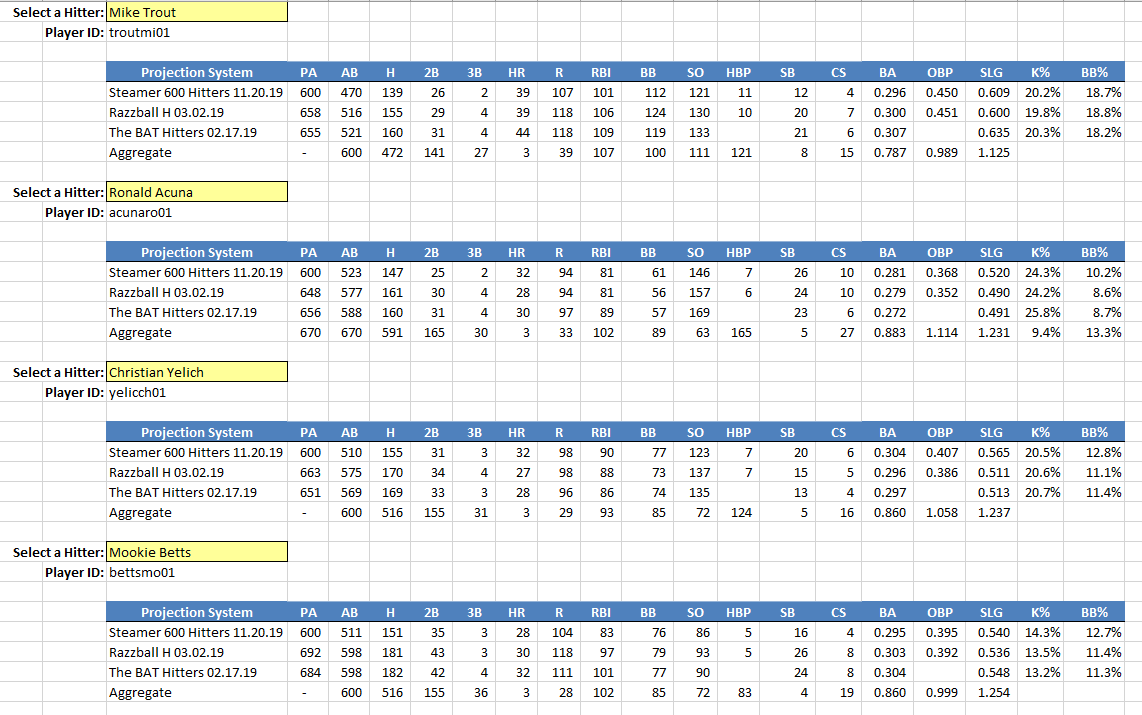
This is Great. What Do I Need for this to Work?
You need Microsoft Excel 2007 or greater for Windows. If you are using a Mac you must be using Excel 2011 (previous versions of Excel for Mac will likely not work).
Buy the Projection Aggregator Now!
The Projection Aggregator spreadsheet costs $9.99. A small price to pay for being able to quickly and easily improve the accuracy of your fantasy baseball projections.Click the “Add to Cart” button below to check out safely using your PayPal account.
Buy the Projection Aggregator for $9.99…

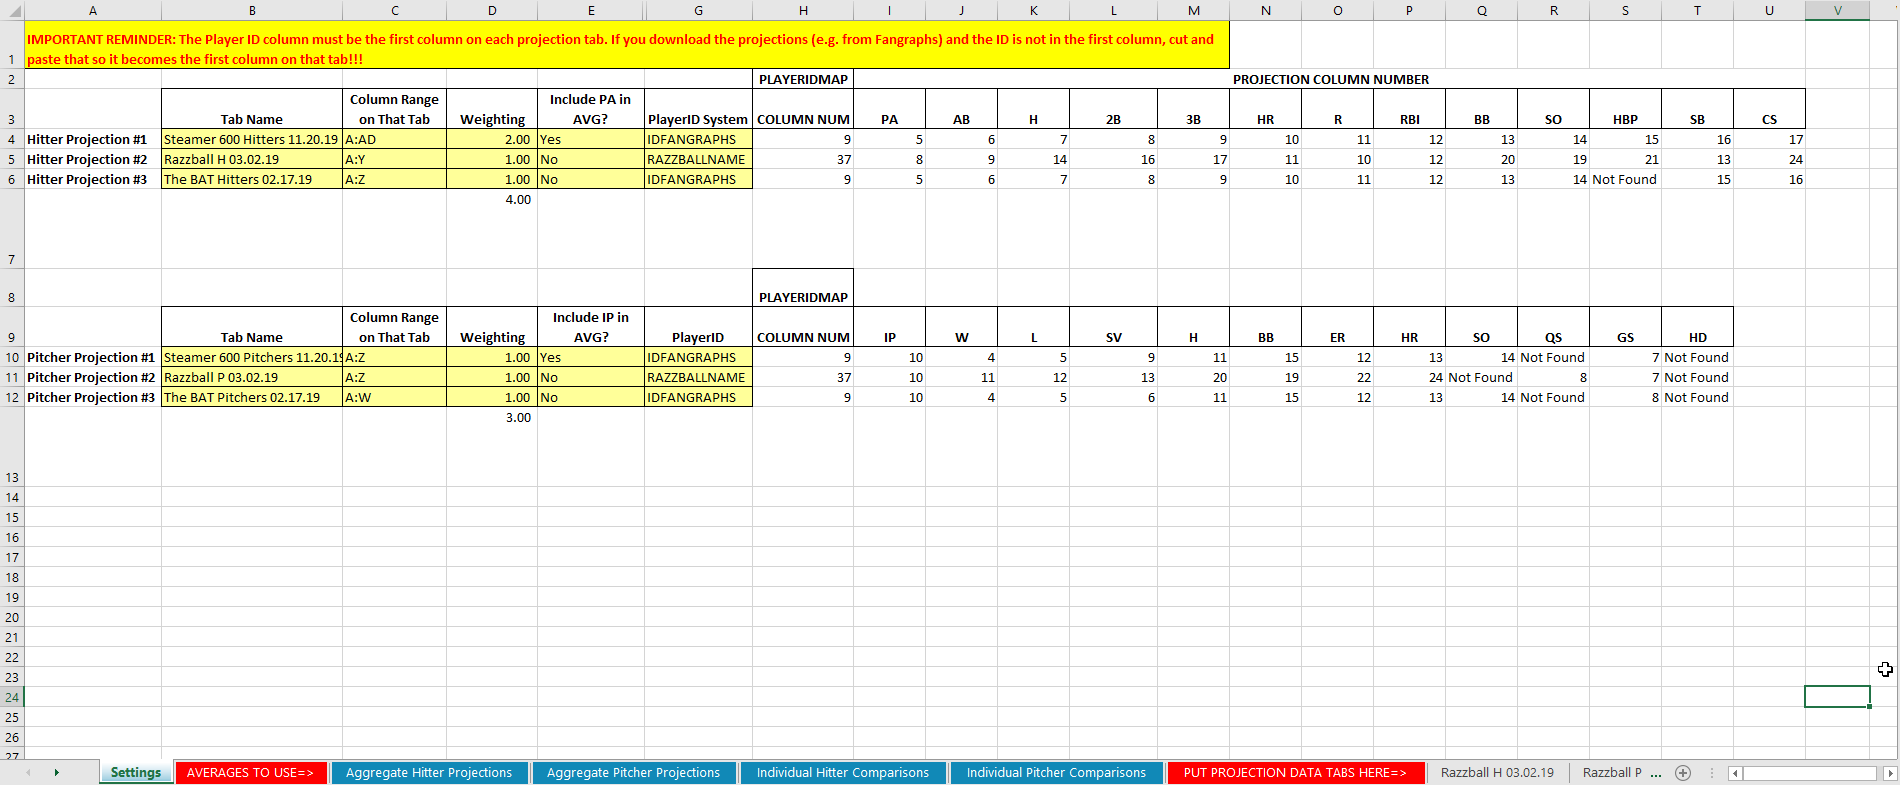
More Screenshots
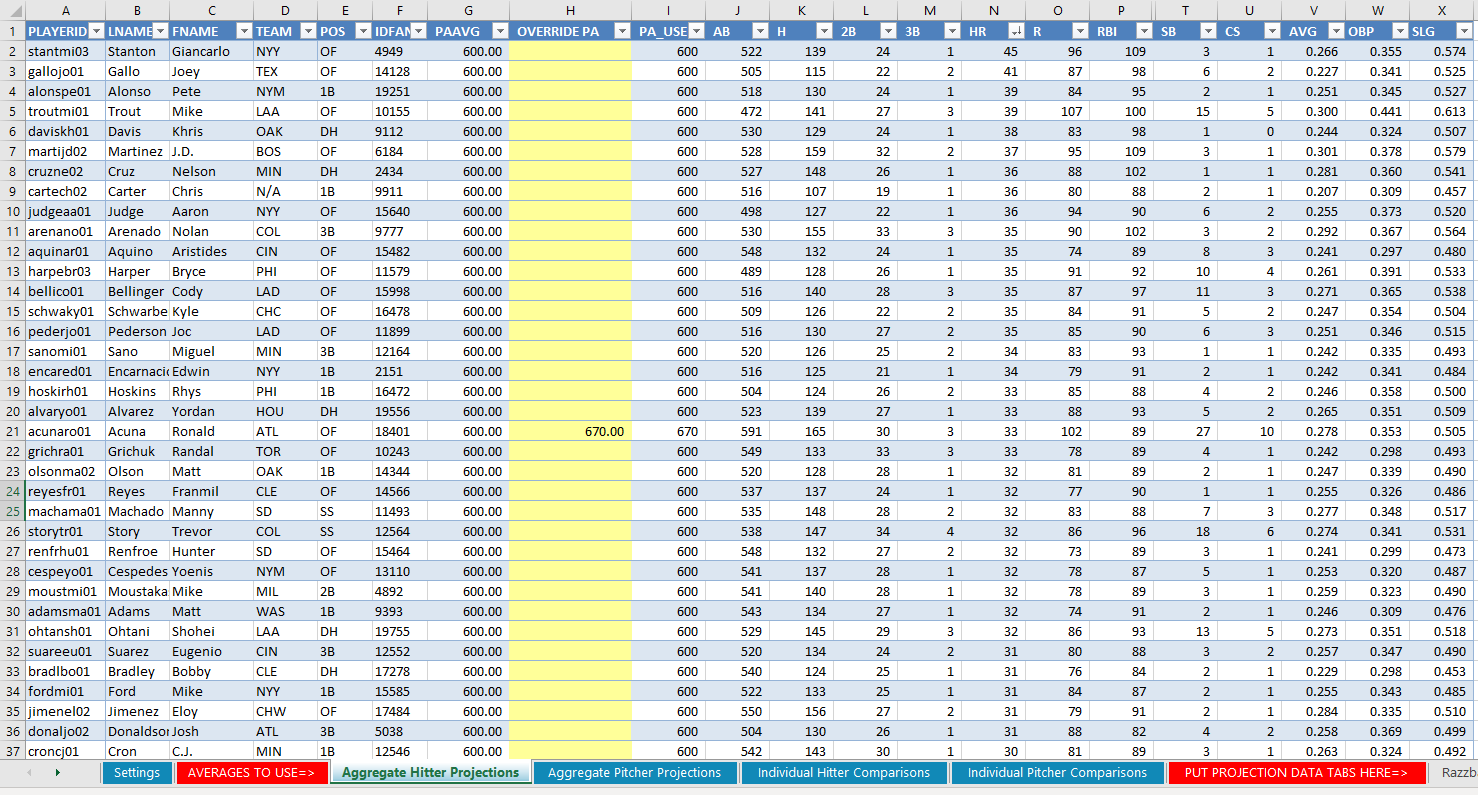
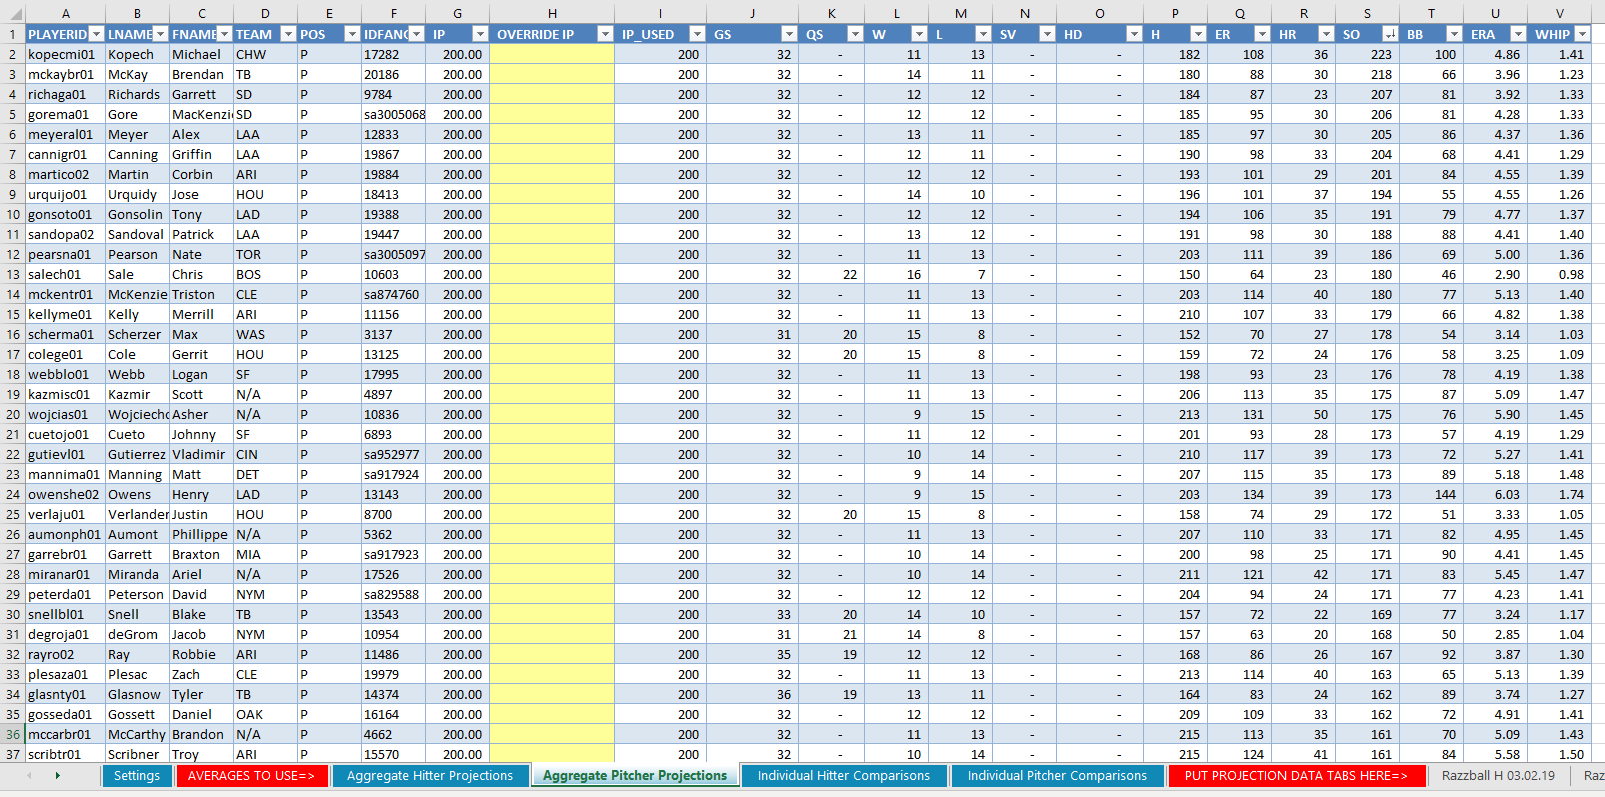

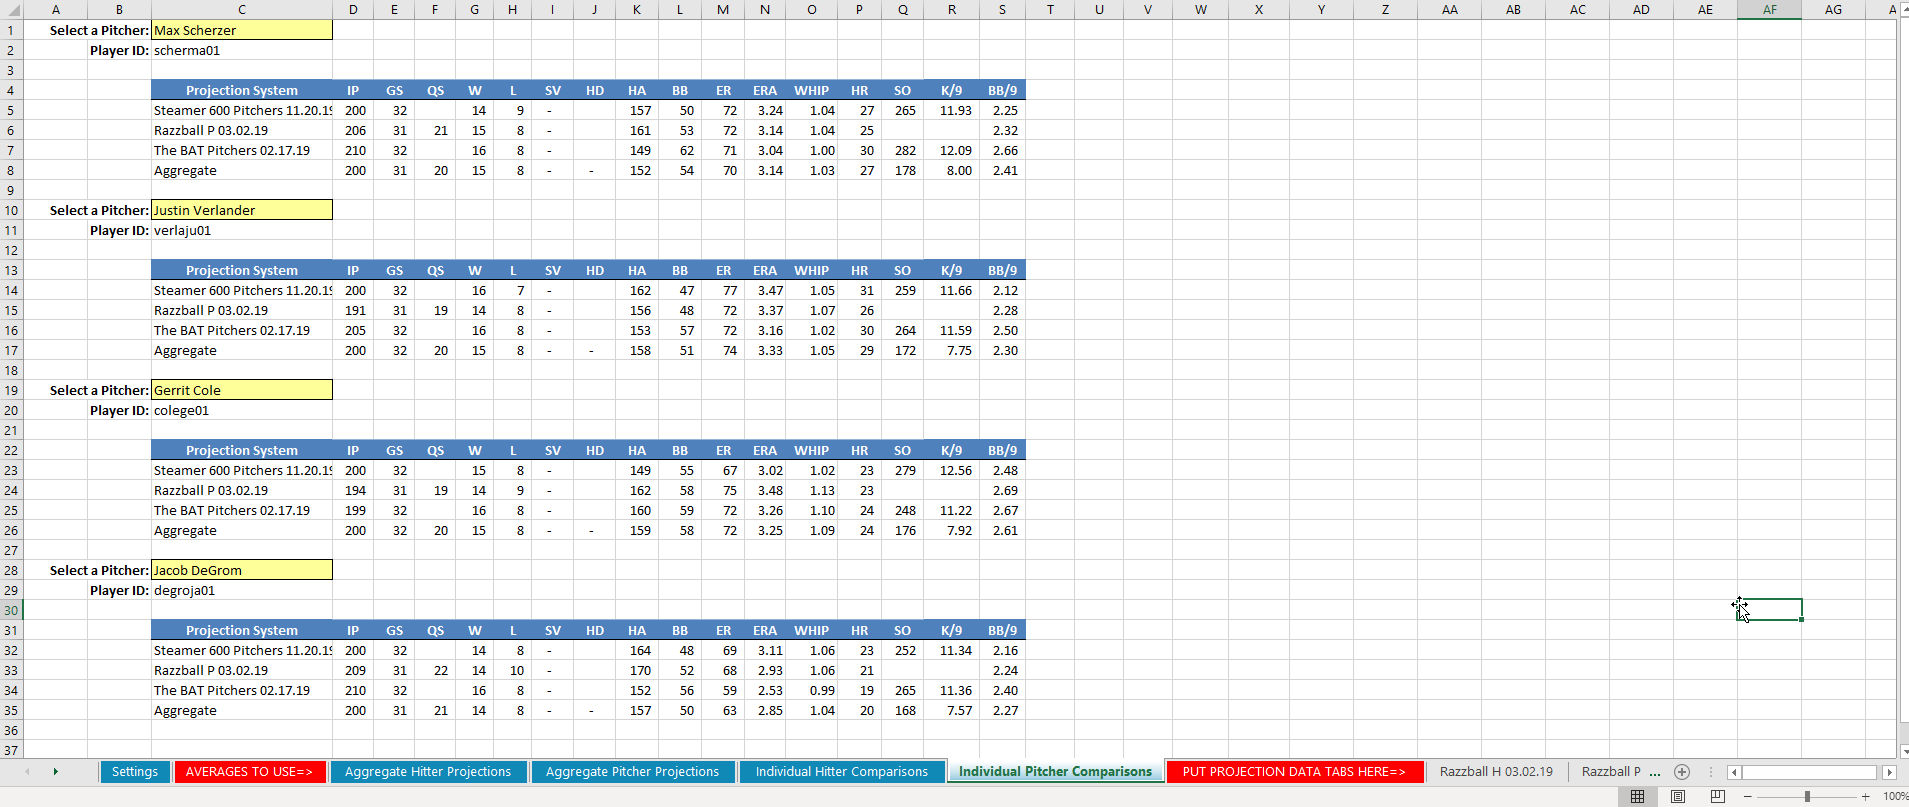
Click the “Add to Cart” button below to check out safely using your PayPal account.

Any chance you could add Quality Starts as a category to projection aggregator? Great tool!
What does the aggregator do with players who do have a projection from a system, but no projection from the system being used for PA/IP? Thanks!
Hi Hank, great question. And I’m now seeing I never replied to your question about quality starts last year. I did add quality starts and holds into the aggregator at some point since last year, so those are included now.
In regards to your question about how the aggregator handles PA if there is no projection from the system designated to control playing time… That looks to be an issue I’ll have to correct in the future. It turns up a zero right now.
With that said, the aggregator does have a column for you to type in your own estimate of playing time that will fully override what the average playing time is calculated as.
Great question. Thank you.
Ideally, the sheet would allow you assign weights for playing time sources, and different weights for projected stat sources. I.e., calc. the [stat] per PA/IP for each source and use them (with user-defined weights) to come up with a [stat] per PA/IP rate projection for each player. Then, calc. the projected playing time (PA/IP) for each player (using a separate set of user-defined weights of sources). Multiply the rate stat projection with the playing time projection to get the final full-season projection.
Can your sheet do this?
Hi Evo,
It can do all of that and possibly even a little more that you might find helpful! Each projection is first converted into a per PA or per IP calculation. You can assign a weight to each projection system for converting these per PA/IP into an average. You can then choose to use the playing time from each projection system with the same user defined weighted average OR to only use the playing time estimate from a selected system.
Lastly, you have the ability to override the playing time (IP or PA) estimate to what you think it will be. This will, in effect, take the calculated weighted average and apply your playing time estimate to that.
Hope that helps.
Tanner
Hi Tanner,
This looks like a really nice tool. I have something similar setup, but still requires too much manual manipulation on my part. I’m considering purchasing this, but I’d like to know if it’s editable – meaning do you have it all password protected or will I be able to make any edits that I see fit?
Hi Steve, nothing is password protected. You can change or edit it as you see fit.
Thanks Tanner
[…] Average Multiple Projection Sets into One […]
Hi Tanner,
Do you have this available for the 2018 season?
Yes, it’s updated for 2018.
Will there be a 2019 version? If so, any chance it could be update to automatically flag the biggest difference in player values or stat lines from the projection sets loaded? That would be amazing. The compare tool as it stands now is good but the user has to check every player in the projection set for differences.
Hi Steve, yes. The 2019 version is available now. I just updated the player list for the recent trades. The version also includes any meaningful players from 2018 and those expected to be relevant for 2019. I don’t have any current plans to make changes in functionality, but your idea sounds interesting. Can you please describe a little bit more about what you’d like to see? Or the information you’re trying to get at? Are you asking to see something like what is on the “Hitter Averaging” and “Pitcher Averaging” tabs? But reordered to show all three HR projections next to each other, all three R projections next to each other, etc.?
Thanks. Typically, I add projections from 3 different sources. For 90-95% of the players, the differences in the projected stat lines are very minor. I’d like to be better able to identify the 5-10% with the differing opinions. Right now, I just have to hunt and peck to identify those outlier players by reviewing each player individually on the averaging tabs. I’m wondering if there is a way to flag the players with the biggest variance. Maybe use the $$ values included in most of these projection sets to flag players with largest differences? Those are the players I’d like to dig into more.
Gotcha. Thanks for the added detail. I have wanted to include a ranking/dollar value component to the aggregator, but it has proven to be very difficult, largely because the aggregator itself is already a little slow due to all the calculations in the spreadsheet. Adding another layer on top to calculate values is a challenge. But it’s a great idea. I’ll think about something I can build in to help with this. My initial thought, if you wanted to experiment a little on your own, would be to add some conditional formatting to the player averaging tabs.
Or it may just really be about playing time. I think playing time will drive the differences much more than skill level. Making the playing time estimate from all three systems visible could help with what you’re trying to do. I’ll add these ideas as something to think about.
So, I was just reading Jeff’s article on FanGraphs Top 250 Hitter Ranking and Comparison. It got me thinking that taking the same approach he used, SPG formula and standard deviation, might be a way to handle my question above from last month. I also see you’ve posted a new tool to calculate SPG from your favorite projection system. Might there be a way to merge some of the Projection Aggregator functionality and the new tool? Run three data sets through the formula and produce and exhibit like Jeff has in his article? Thinking out loud as it’s way out of my Excel skills level. Obviously, I could use his analysis on FanGraphs but I am a fan of three very specific projection systems so would rather replicate it with those only if possible.
Hi Steve, there definitely is a possibility of merging the two tools together. I may try it later in the offseason or for next year. I’m hesitant to invest a lot of time on that project because I think the amount of calculations that will take will make the Excel file unusable. The Projection Aggregator is already a bit slow as it is, just because it has thousands and thousands of calculations taking place to average all the various stats for so many different players. Layering complicated rankings formulas on top may be too much.
With that said, the two files can be used independently and will work just fine as stand alone options. You could copy the end results from the Projection Aggregator into the ranking tool and it will work well, without the slowness of having all the calculations in one file.
Hi Tanner. I typically do this by hand and this would be a great tool. Any chance you could incorporate the projections from 4 systems instead of 3? Also it sounds like it would be fairly easy to incorporate end results into the SGP spreadsheet? Thanks Tanner!
Hi, Kelly. Great questions. It’s possible for me to bump it up to a fourth. But it might not happen for 2-3 months? I will be working to update all my tools for the 2021 season soon. I can have that on the list.
I do think it’s fairly easy to copy and paste the results from the aggregator into the SGP spreadsheet. I don’t recommend combining them into one file. The volume of calculations becomes too much and the file isn’t practical to use for a draft when they’re combined.
[…] Projection Aggregator $: The Projection Aggregator is an Excel template that will help you to easily combine and average up to three different projection sets into one more accurate set of projections. […]
[…] Average Multiple Projection Sets into One […]
[…] Average Multiple Projection Sets into One […]
[…] Average Multiple Projection Sets into One […]
[…] Average Multiple Projection Sets into One […]
[…] Whereas my hitting and pitching projections have held their very own relative to different distinguished techniques by way of forecast accuracy, I don’t declare that my system is revolutionary, nor that it’s essentially the very best among the many varied options — not that you must imagine me if I did, given the tendency of forecasters to search out proof confirming the prevalence of their very own techniques. Projection techniques are the results of a whole bunch of subjective choices by the analyst, with many alternatives to do issues barely (or very!) in another way. For example, I exploit my very own taste of growing older curves and main league equivalencies, and embrace variables like Stuff+ and swing velocity that won’t but be captured by different techniques. Methodological variety could also be why averaging the distinguished projection techniques tends to be an efficient strategy. […]