Start Preparing for the 2017 Season!

It’s time! Are you getting the itch to start thinking about fantasy baseball again? Are ready to take on a new challenge this year and calculate your own rankings or create your own projections? All spreadsheet templates have been updated for the upcoming 2017 season. Take a look at the available books and tools below.

Title Description
Bundle Image The Projecting X 2.0 Bundle
***UPDATED for 2017***

The Projecting X 2.0 Bundle comes with Mike Podhorzer’s instructional guide to creating your own baseball projections, as well as an accompanying Excel template to help save you hours and hours of time as you work through the projection process.

The Projecting X 2.0 Excel Template Only
***UPDATED for 2017***

(NOTE: the Excel template requires you to enter certain formulas from the book, Projecting X 2.0. If you purchased the bundle prior to the 2016 season, this is being offered to save you the time of having to manually update the player names, teams, and positions in the spreadsheet in order to start projecting the 2017 season.)

AGGREGATOR Projection Aggregator
***UPDATED for 2017***

An easy-to-use Excel spreadsheet that can combine (or average) up to three different projection sets. The aggregator can use just about any well known projection set you can find on the web (if you find one that doesn’t work, let me know!). Simply download your favorite projection sets, fill out some settings, and you’re done. No complicated formulas or VLOOKUPS for you to add.

Using Standings Gain Points to Rank and Value Fantasy Baseball Players

Ever wanted to create your own rotisserie rankings? This is my instructional guide written specifically to show you how to create customized rotisserie player rankings, dollar values, and inflation dollar values, in Microsoft Excel, tailored to your own league. No more downloading rankings from the web, hoping they apply to your unique league. 10, 12, or 15-team league? $260 or $300 budget? AL-only or mixed league? 10 hitters or 14? It doesn’t matter. This book will guide you through the process of developing rankings for just about any kind of rotisserie league.

How to Rank and Value Fantasy Baseball Players for Points Leagues

My step-by-step guide to building custom rankings, dollar values, and inflation dollar values, in Microsoft Excel, for your points league. This book will guide you through the process of developing rankings for just about any point-based scoring format.

Player ID Map Updated for 2016-17 Offseason

It’s been awhile. But, yes, I’m still alive! And if you’re like me and itching to start thinking about and preparing for next season, you’ll be excited to know the SFBB Player ID Map has been updated.

The update includes additions of many players that entered the major leagues during the 2016 season as well as players projected to be impactful for the upcoming 2017 season.

In addition, players’ teams listed in the spreadsheet are updated for all transactions that occurred through December 6th. Finally, player positions have been updated to reflect games played during 2016. The position listed reflects the “most valuable position” played (if a player qualified at catcher and first base, he’s listed as a catcher).

You can download the updated map here.

Or you can view a web version here.

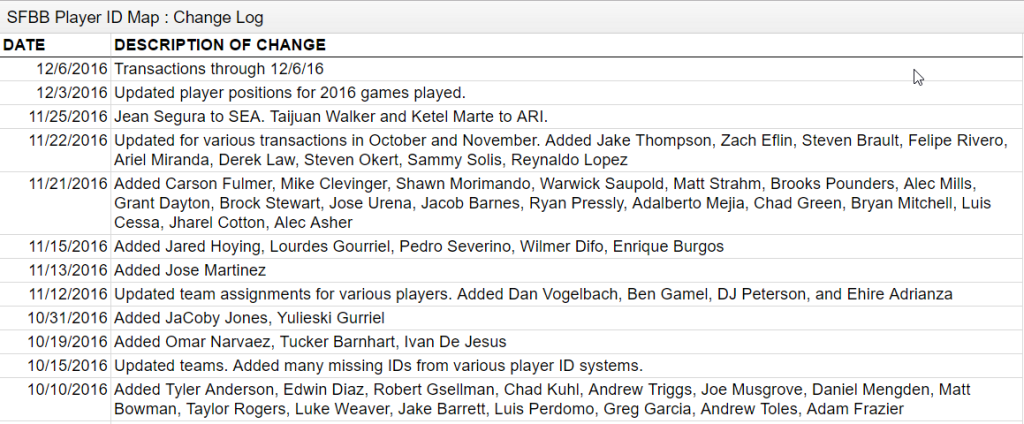
A complete list of changes can be viewed here or on the “Change Log” tab of the spreadsheet.2017updates

If you’re new to the site, consider checking out these past posts that illustrate some interesting things you can do with player IDs.

Please let me know if I’ve missed anyone (you can use Twitter to do that). Stay smart.

My Recent Writings… at Rotographs!

What awful fantasy baseball site posts only four times leading up to draft season???
If you just happened to stumble upon this site (hopefully a Google search for fantasy baseball spreadsheet brought you here), you’re probably thinking to yourself, “How can I trust a fantasy baseball website that has only published one article since January 2016?”.

And that’s a fair question.

Instead of going it alone, as I’ve done the last three years (has it really been that long already???), I’m now writing at the Rotographs section of Fangraphs. For the near future, you should be able to find a new article there, from me, every Friday morning. You can see an archive of what I’ve already written here.

Is SFBB Shutting Down?

No! While it will be difficult for me to continue posting here at the same pace, the site isn’t going anywhere. I do hope to add more spreadsheet tips and analysis here, and you will also be able to find that in my writing at Rotographs.

I’ve already snuck in a couple of Excel pieces over there and haven’t gotten fired yet!

SmartFantasyBaseball will also be my home for the tools, spreadsheets, and guides that I create. The Player ID map and any serious “how to” lengthy series (like my standings gain points and points league series) will be here.

One major benefit of the Rotographs shift is that I will be publishing something EVERY WEEK! I used to aim for only twice a month.

My Work So Far at Rotographs

Here’s a short summary of the pieces I’ve already published over there:

  • A Look at 2015 AL-Only Standings Data – Thanks to the fine folks at OnRoto, an analysis of 76 different 12-team AL-only leagues, including the average final standings, statistical category targets to shoot for, standings gain points calculations, and average hitter and pitcher stats for each roster spot. Click here to read the article. Includes a link to an Excel file download and a Google Sheet document of the raw data.

  • A Look at 2015 NL-Only Standings DataOnRoto provided the data for 51 different 12-team NL-only leagues. I converted that information into category targets to shoot for, SGP calculations, and average stats required from each hitter and pitcher. This one also includes a link to an Excel file and a Google Sheet of the raw standings information.

  • Why You Should Aim for Third Place – This sounds rather defeatist, but I took 30 NFBC leagues’ standings data and charted out all of the results. What I found is that aiming to finish in third place in each rotisserie category looks to be the optimal use of your resources during the draft.

  • Making Simple Edits to Projections for R, RBI, and PA – Have you ever wondered what the effect of hitting in different spots in the lineup has on runs and RBI? Well what if the player is in the AL? Does that matter? Or what if he’s on a team projected to score 650 runs? What if he’s traded to a team that will score 750? This post comes with a series of handy charts that can help you quickly answer questions like these.

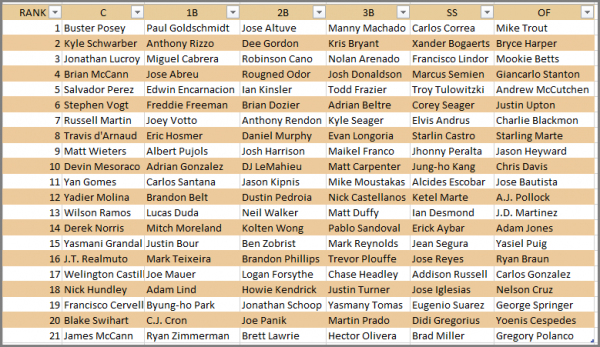
  • How to Create a Position Cheat Sheet in Excel – Step-by-step instructions on how to add a cheat sheet, like the one shown below, to your Excel file.

    CHEAT_SHEET

  • Properly Valuing Hitters with Injury Risk – Follow along as I attempt to value players, like Giancarlo Stanton, perceived to have a large amount of injury risk associated with them. What is the proper way to make this adjustment? How big of an affect does it really have?

  • How Does Batting Order Affect Stolen Bases – A closer look at how stolen base attempts are affected by where a player hits in the lineup. Do you need to worry if your speedster is being moved to third in the lineup? Can you expect a slow base runner to steal more if he’s moved into the leadoff spot? Answers to these questions and more!

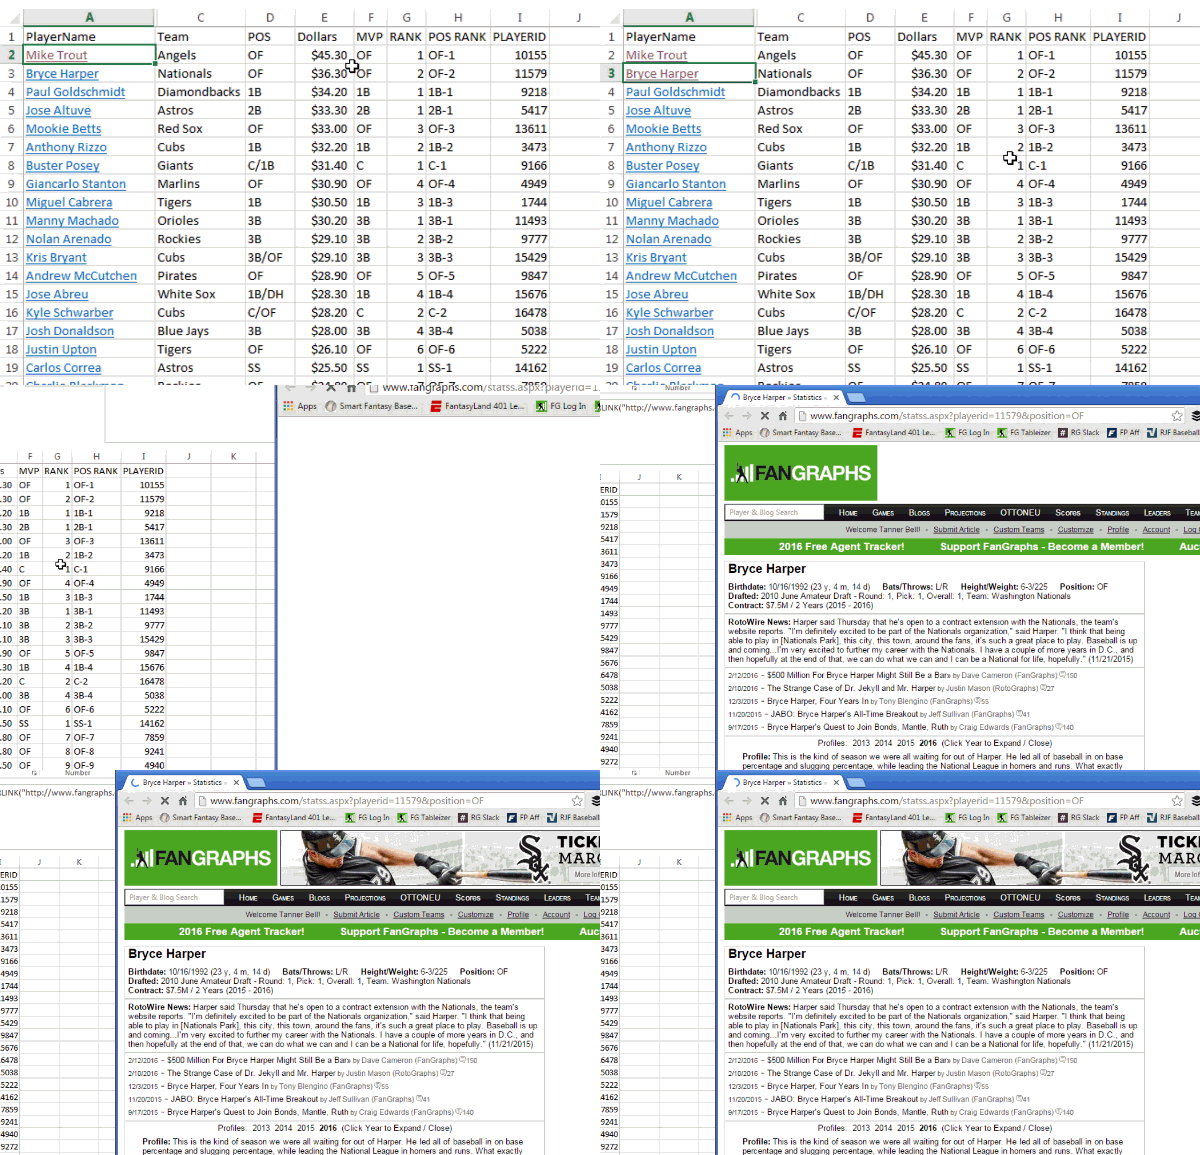
  • How to Add Player Page Links to Your Draft Spreadsheet – Another handy feature to add to your draft spreadsheet. Adding these clickable links to your file will help you look up players on Fangraphs quickly and easily during the pressure-filled draft.

    ClickableLink

  • Tanner Bell’s 10 Bold Predictions for 2016 – Making player predictions and going out on a limb for guys is not my M.O. But it was fun participating in one of my favorite annual Fangraphs traditions. Gerardo Parra, Jose Altuve, Marcell Ozuna, Lorenzo Cain, and more (some good, some bad)!

Stay Smart

Best of luck this season. Be sure to follow me on Twitter so we can keep in touch and so you can be kept up-to-date on new tools and articles.

Updates to the Player ID Map – Ottoneu ID and Baseball HQ ID

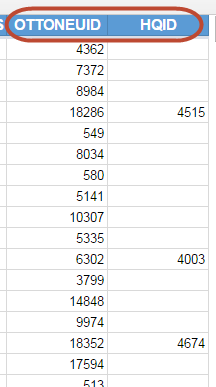
OTTONEUID_BASEBALLHQID

I’ve recently made some notable edits to the Player ID Map that should be helpful to many.

  1. Added a field for “OTTONEUID”
  2. Added a field for “HQID” (for Baseball HQ player IDs)
  3. Updated “POS” column to reflect games played during the 2015 season. I determine which positions a player qualifies at using a 20 game minimum and then assign the player to ONLY his most valuable position. I assume position value goes C, SS, 2B, 3B, OF, and then 1B.
  4. Added several new players

The Ottoneu ID column is almost completely full of IDs, there were very few players I had on my list that are not in the Ottoneu universe. In fact, I think it’s just the foreign players coming to MLB for the first time this season (Maeda, Park, etc.). The Fangraphs IDs for those players recently became available and they ARE now included in the map.

The Baseball HQ ID column is not nearly as populated. It only includes about 450 or so players that I think are included on one of HQ’s current year rankings files.

I’ve also added players like Zach Davies, A.J. Reed, Max Kepler, Tim Anderson, Orlando Arcia, Trevor Story, and Adam Conley.

Player Name Fangraphs ID
Kenta Maeda 18498
Byung-ho Park 18717
Hyun-soo Kim 18718
Orlando Arcia sa596917
Tim Anderson sa737508
A.J. Reed sa599279
Max Kepler 12144
Zach Davies 13183
Trevor Story sa597765
Adam Conley 14457

As usual, if I’m missing a player or if you find an error on the log, please e-mail me or send a Tweet to @smartfantasybb with the information. I do try to keep the log current with “fantasy relevant” players. But that definition gets real cloudy when I start to consider DFS.

I’ll try to add these new ID systems to the Projection Aggregator soon, but I think HQ reports typically include “MLBAM ID”, so you can always use that instead.

Reminders

You can stay up to date with the changes on the Player ID Map here.

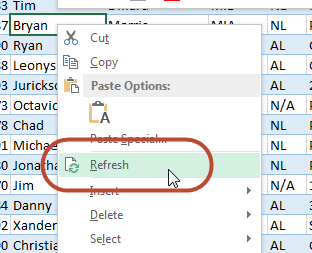
REFRESH_PLAYERIDMAPIf you have Excel 2013 and you’ve downloaded the “new” version of the Player ID Map, you can right click anywhere in that tab of the spreadsheet and choose to “Refresh” the connection. Excel will seamless download the new updates to your file.

If you don’t have this version, you can read about how it works and how to get this version here.

How to Analyze SGP Denominators from Different Sources

Do you know if the SGP calculations you’ve done for your league are accurate?

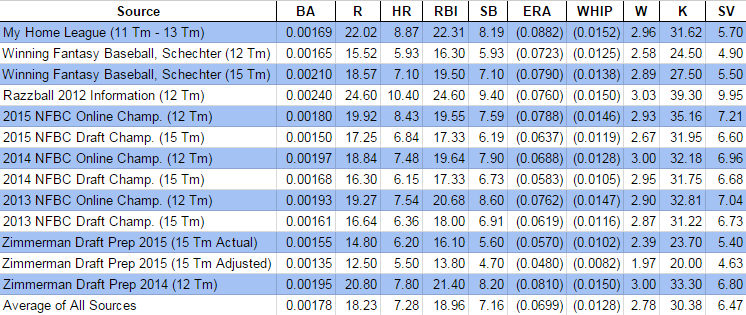
Are you concerned that your home run SGP denominator is 8.87 and Larry Schechter’s book Winning Fantasy Baseball suggests using 5.93 for a 12-team league? Or that your RBI calculation shows 22.31 and the 12-team NFBC history I just calculated shows 19.55?

What does this all mean? Will your rankings be accurate? How can they be when your denominators seem significantly different than those you see elsewhere?

Calm Down, These Numbers Are More Consistent Than You Realize

I know. You’re wondering how on Earth I can say that. How can a HR denominator of 8.87 be consistent with one of 5.93?

To be honest, I’ve had those same fears about SGP. I feel so scientific and strategic by calculating SGP. And then I look at my denominators in comparison to what I see published elsewhere and that confidence evaporates and is replaced with doubt.

In this post I’m going to share an important realization I just had about SGP (yep, I’m still learning too), show you how to properly compare your SGP denominators to different resources, and demonstrate that the dollar values calculated by different sets of denominators are more similar than you would believe. When we’re done here, I think we’ll all feel a lot more comfortable about things.

Story Time

This story starts with me calculating the SGP for the last three seasons of NFBC leagues (which make their standings information publicly available).

I read Winning Fantasy Baseball a couple years ago (if you haven’t read it and you’re about to read 2,500 words on SGP denominators, you really should get the book), and I vaguely remembered the book giving SGP denominators for a variety of league types. I wanted to verify that my findings were similar to Schechter’s.

Here’s what I found:

Source BA R HR RBI SB
2015 12-team NFBC Online Championship 0.00180 19.92 8.43 19.55 7.59
Winning Fantasy Baseball 12-team League 0.00165 15.52 5.93 16.30 5.93

Damn. WTF does this mean? Those don’t look close to me. Did I do something wrong?

A Very Important Point

As I looked more closely at the book, I noticed I missed a very important point the first time I read it. Next to each number, Schechter had calculated a “relative SGP value”.

SGP Type BA R HR RBI SB
Raw SGP Denominator 0.00165 15.52 5.93 16.30 5.93
Relative SGP Denominator n/a 1.05 2.75 1.00 2.75

And here’s the important point Schechter makes about these calculations:

… when you’re trying to adjust SGPs for leagues of various sizes, it’s important to realize that the raw value of the SGP isn’t very important, but rather the ratio of the values.

~ Larry Schechter, Winning Fantasy Baseball

Mine Is Bigger Than Yours Is

I glossed over that red bolded sentence on previous reads (because it’s not bolded red in the book…). But this small statement buried in the middle of the 350-page book is exactly the point I needed for the self-doubt I was experiencing.

So in order to hopefully save you the same trouble, take note! You can’t compare your SGP denominators to someone else’s. You have to convert them to a relative scale first.

Raw Versus Relative – An Example

Let’s focus in on just the HR and RBI stats from the table above.

SGP Type HR RBI
Raw SGP Denominator 5.93 16.30
Relative SGP Denominator 2.75 1.00

If it takes 16.30 RBI and 5.93 homers to move up the standings, this essentially means that one home run is 2.75 times more important than one RBI (home runs are more scarce, so getting one of those is more valuable than the more common commodity, RBI).

16.30 / 5.93 = 2.75

Do you remember working with fractions in elementary school? I liken this practice to that whole “lowest common denominator” charade we had to go through. Dropping the SGPs to a relative scale is like converting them to a lowest common denominator. If you leave the SGP factors grossed up at these high numbers (like 5.93 and 16.30), it’s more difficult to see the relationships you can see when they’ve been translated into the relative scale.

One More Math Concept

If you read Using Standings Gain Points to Rank and Value Fantasy Baseball Players or if you’re generally familiar with the SGP approach, you know that we would divide a player’s home run total by the home run “SGP denominator” to know how many SGP the player contributes due to his homers.

For example, if a player is projected by 30 home runs, an SGP denominator of 5.93 would indicate the player’s homers are worth 5.1 points in the standings (30/5.93=5.1). If the same player is projected for 83 RBI, an SGP denominator of 16.30 suggests the RBI are also worth 5.1 SGP (83/16.30=5.1). The 30 HR are worth the same as 83 RBI (5.1 SGP).

However, the way Larry Schechter has calculated his relative SGP would require you to multiply a player’s stats to achieve that same equality. For example, the 30 HR multiplied by 2.75 is 83 “points”. The 83 RBI multiplied by 1.00 is also 83 “points”. The 30 HR are worth the same as 83 RBI (83 relative SGP).

For Consistency, I Will Calculate Relative SGP Another Way

If you look back at the big bolded numbers above, Larry Schechter used the largest statistic (RBI for hitters and K for pitchers) as the numerator in his conversion. I will use it as the denominator.

5.93 / 16.30 = 0.364

I’m mostly doing this because everything I’ve written about SGP to this point tells you to DIVIDE BY THE SGP DENOMINATOR (heck, it’s called a denominator, meaning it’s on the bottom of the fraction). To now tell people to MULTIPLY BY THE RELATIVE SGP DENOMINATOR seems too confusing to me.

I’m sure I’ve confused the hell out of everyone at this point either way. And I apologize for this. But I think this topic is very important to understand. I’m giving it my best! Even if you’re confused, keep reading. I think this will all pull together very nicely in the end.

Going back to our example of a player with 30 HR and 83 RBI, if I divide by an SGP denominator of 0.364 I get that same 83 “points” (forgive the rounding), meaning the 30 HR are worth the same as the 83 RBI under this approach. So whether you use Schechter’s relative numerator and multiply or my relative denominator and divide, you get the same results.

How to Calculate “Relative” SGP Denominators

I’ve talked a lot about multiplying and dividing. So just to be clear, to put your SGP denominators on the same relative scale, choose the category with the largest numeric value, then divide each stat categories raw SGP denominator by that largest raw SGP denominator.

The largest numeric denominator is typically RBI for the hitting categories (the 16.30 from above is the largest SGP denominator) and strikeouts for pitching.

For the rest of this post I will be using this calculation of relative SGP denominators and NOT the way suggested in Winning Fantasy Baseball.

My NFBC Relative Versus Winning Fantasy Baseball’s 12-team Relative

Using the method described above, I calculated the relative denominators for Larry Schechter’s 12-team suggestions and my 2015 NFBC findings. Here are the results:

WINNING_FANTASY_BASEBALL

First look at the white lines. These give me that queasy feeling I was describing earlier. He’s saying 5.93 HR for a 12-team league? And I came up with 8.43? That’s 2.5 HR difference. How can these suggestions even be in the same ballpark?

Now look at the yellow-shaded lines. After everything is put on the same scale things look a lot more reasonable. When you look at all items on a relative scale, you can see many of the categories are strikingly similar (BA, R, RBI, SB, K, SV), but still show small variations. There is some variance in the other categories, but things don’t look as stark as with the raw denominators. This supports our beliefs about SGP being able to “tailor” to our league tendencies and preferences, but still leaves me feeling a lot more comfortable that my denominators are in fact closer to Larry Schechter’s than it appears on the surface.

Right around this time I’m starting to feel more comfortable with my analysis. But I’m also very curious about what happens if I start looking at SGP denominators from other sources. So I set out to find as many sources as I could find.

NOTE: After publishing this article, it came to my attention that there’s a typo in Winning Fantasy Baseball that makes this last segment somewhat less relevant. I’ve elected to keep it in despite this.

Other SGP Denominator Sources

The reliable sources I was able to locate for this analysis are:

Not bad. I was able to scrape up 13 different resources for comparison. And I threw in the average of those 13 resources as my 14th.

Here’s the Raw SGP Data

You can see things are all over the map. You can see general patterns, but the data fluctuates wildly. Some of the raw SGP denominators are almost double others. For example, Larry Schechter’s 12-team HR denominator is 5.93 while Razzball’s 2012 article calculated a 10.40!

And Here’s the Relative SGP Data

Continue reading “How to Analyze SGP Denominators from Different Sources”
How to Get Reliable SGP Data

I’m an SGP guy. Standings gain points are what I first learned. The approach has been good to me. And it seems I’ve been fairly successful using the approach. But SGP has a weakness. It’s a big weakness that prevents a lot of fantasy baseball players from using the approach.

Where Can I Get Reliable SGP Data?

Where can I find historical SGP data??? This is one of the most common questions I get about the use of standings gain points. If you’re starting a new league, don’t have access to league history, or switched website providers, you’re screwed. You can’t really start using SGP. And let’s not even mention those of you that play in AL or NL-only leagues (I still don’t have an answer for that, sorry).

In this post I’ll share with you where and how you can get great quantities of actual league standings in competitive mixed leagues (again, sorry mono-leaguers, I would love to help you one day but I haven’t found out how yet).

I got the idea to do this by reading Jeff Zimmerman’s fantasy draft prep series in 2014 and 2015.

Where Can You Find Standings Information for Competitive Leagues?

I haven’t proven the theory yet, but I’m pretty certain you could write some kind of web scraping program to pull down the standings information for public Yahoo! and ESPN leagues. But who knows what the level of competition is in those? You would have to find a way to weed out the non-competitive leagues and teams to prevent those that draft and then never change their lineup the entire season from distorting the standings information.

NFBC_LOGO

Enter the National Fantasy Baseball Championship (NFBC)

The National Fantasy Baseball Championship (NFBC) is the industry leader in premium fantasy baseball leagues. Meaning leagues that people pay an entry fee to join in an effort to win prize money.

The fact that people are paying money to enter these leagues and that prize money is at stake is the best mechanism we could hope for to ensure competitiveness. The standings information will not be tainted by schleps that draft a team and abandon in after the first week of the season.

Not only that, but the NFBC also publishes final league standings by category and makes them available to anyone! This is an SGP jackpot.

Different Types of Leagues

The NFBC has several different competitions. The two most likely to be of value to us are the “Online” and “Draft Champions” leagues. These leagues have the most entrants, so we can reduce concerns over small sample sizes. Here’s a summary of the two league types and links to the standings information for them:

NFBC League Type Standings Links Description of League
Online Overall Standings
BA, R, HR, RBI, SB
ERA, WHIP, W, K, SV
  • Standard 5×5 roto categories
  • 12 teams
  • Online 30-round draft
  • Standard 23 player lineup (14 hitters, 9 pitchers, 7 bench spots)
  • Online drafts, February through April
  • Free agency FAAB bidding proccess
  • No trading
Draft Champions Overall Standings
BA, R, HR, RBI, SB
ERA, WHIP, W, K, SV
  • Standard 5×5 roto categories
  • 15 teams
  • Online 50-round slow draft
  • Standard 23 player lineup (14 hitters, 9 pitchers, 27 bench spots)
  • Online drafts, November through April
  • Draft and hold, no free agency
  • No trading

So the big differences to note are that the “Online” leagues have 12 teams and a 30 round draft. The “Draft Champions” leagues have 15 teams and have 50-round drafts because they don’t have free agency during the season. We’ll a look at this in future posts to see if it seems to affect things.

Now That We Have This Information, What Do We Do Next?

There were 125 leagues and 1,500 teams in the 2015 Online NFBC leagues and 192 leagues and 2,880 teams in the 2015 Draft Champions leagues.

That’s a lot of data. Is there a practical way to take all of that data and use it to calculate SGP factors? Of course!

You’re Boring Me and I Don’t Want to Do This Myself

NOTE: I’m about to go through instructions how to calculate the NFBC SGP numbers yourself, but if you just want my completed analysis, you can download them here:

I may not update this information every year into the future… So remember, the instructions below will remain so you can do this yourself!

Excel Functions Used in this Post

We’ll be using the SLOPE, IF, and AVERAGEIFS formulas to calculate SGP for the NFBC leagues.

SLOPE

You can read more about the SLOPE formula in a three part series I wrote about here, here, and here.

The short description is that the SLOPE function finds the line of best fit through a given set of data points. With our rotisserie standings data, the SLOPE formula essentially calculates the actual SGP factor or denominator. I’d highly suggest reading the three part series. Or at least Part I!

IF

The IF function checks to see if a condition is met. If the condition is met, the function returns one response. If the condition is not met, the function returns another response. One important fact to realize is that the responses you specify in the IF formula can be formulas. So if the condition you specify is met, you can have the cell use formula A. And if the condition you specify is not met, you can have the cell use formula B.

The function requires three inputs:

  • Logical_Test – This is typically a formula to be evaluated. An example might be “is cell C2 greater than cell D2”.
  • Value_If_True – This is the value to be shown or the formula to be evaluated if the Logical_Test is passed,.
  • Value_If_False – This is the value to be shown or the formula to be evaluated if the Logical_Test is failed.

AVERAGEIFS

The AVERAGEIFS formula will calculate the mean of groups of cells that meet a set of conditions. You can specify multiple groups of cells and multiple conditions that must be met. The function requires three inputs (but can use more…):

  • Average_Range – These are the cells to be included in the calculation of the average
  • Criteria_Range1 – This is the first set of cells you want to be evaluated for the condition
  • Criteria1 – This is the condition that must be met for the item in the Average_Range to be included in the calculation of the average
  • If you have more conditions to be evaluated, you can continue to add pairs of Criteria_Range2 and Criteria2, Criteria_Rang3 and Criteria3, etc.

This is a little vague until I tell you more about how we will design this spreadsheet to work.

Our goal will be to design a spreadsheet containing a separate tab for each rotisserie scoring category.

ROTO_CATEGORIES

And one tab that will analyze each scoring category and calculate the average needed to finish in each place for that category. For example, this table will show what the average batting average was for each of the 15 places in an NFBC Draft Champions league.

This is what the finished spreadsheet calculating the NFBC average standings will look like.

Each cell under the roto categories will contain an AVERAGEIFS formula. For example, the table tells us that first place in the Batting Average category had an average of 0.277. The formula in this cell is set up to look on the “BA” tab for the batting average of each team (the Average_Range), then look in the “Place in League” column (the Criteria_Range1) for any rows with a “1” in them (the Criteria).

That 0.277 calculation is the average of all (and only) first place teams.

Step-By-Step Instructions to Calculate SGP for NFBC Leagues

In the instructions that follow I’ll be calculating the SGP factors from the 2015 NFBC Draft Championship standings data.

Continue reading “How to Get Reliable SGP Data”

Now Available – The Projecting X 2.0 Bundle!

Projecting X 2.0 and the updated Excel template are now available!
Projecting X 2.0 and the Excel Template are now available!

Yes, that’s right. Mike Podhorzer has just released Projecting X 2.0. And I’m excited to announce an updated Projecting X Excel template has been upgraded to be more helpful than ever and has been updated to be consistent with all the new projection methodologies used in Projecting X 2.0.

NOTE: The Projecting X 2.0 Bundle has been updated for the upcoming 2017 MLB season.

What’s New in Projecting X 2.0?

While I would not consider version 2.0 to be a complete re-write of the original Projecting X, it’s certainly an improvement of the process, methods, and formulas used in the original book.

Don’t get me wrong, I love the Projecting X approach. But I did feel there were a couple of methods in the original version that I thought had room for improvement. For example, I’ve come to learn that using K% is superior to using K/9. And I thought the approach to projecting runs and RBI was too subjective.

Well, Podhorzer has addressed all of those issues, improved upon several of his methods, and even introduced new ones.

My favorite changes to the process are:

  • A much improved and more scientific methodology for projecting Runs and RBI
  • Switching from K/9 and BB/9 to K% and BB%
  • A method for projecting quality starts (I get asked about QS projections all the time!!!)
  • Addition of metrics like strike percentage (STR%), looking strikes (L/STR), and swinging strikes (S/STR) to pitcher projections, and
  • Revisions to the projection of stolen base frequency

What’s New in the Excel Template

The Excel template has been updated to be 100% consistent with all the new methodologies and formulas used in Projecting X 2.0. Take a look.

If you’re a user of the Projecting X 1.0 Excel template, the biggest improvements in the file are:

  • Addition of career stats
  • Addition of a customizable three-year weighted average
  • New team hitting and pitching totals that sum as you project
  • More league average information
  • New links to Baseball Savant, Brooks Baseball, and RosterResource.com
  • It’s now easier to add a new player to the spreadsheet
  • The Player ID Map is now easily refresh-able so that when I add new players or change player teams, this information updates in your spreadsheet too

Download the Updated Bundle Today

The updated book and spreadsheet are available for the bundled price of $17.99 (they separately sell for $9.99 each). Click the Add to Cart button below to begin the checkout process.

PDF (recommended) Buy Now
AZW3 (Kindle) Buy Now
EPUB (Nook, Apple iPad/iBooks, Sony Reader, Kobo) Buy Now
View Cart

Continue reading “Now Available – The Projecting X 2.0 Bundle!”

An Important Lesson and How to Resolve VLOOKUP Errors

Let me come clean. I screwed up. And it likely will cause you to see errors in your spreadsheets. That’s the whole reason for this post.

Having trouble with VLOOKUP error messages? This post should help.

What Happened?

While this post is going to address a very important topic (resolving VLOOKUP errors), there wasn’t much of a need for this until I came up with a new format for the Player ID Map. The intent was to make the Player ID Map easily updatable. I hate having to lookup the IDs, birth dates, and handedness of all the new players.

And it’s always bothered me that there was no easy way for you to get updated Player ID information.

Let’s be honest. It’s a pain in the ass. Especially this time of year when players are switching teams every day and minor league players we haven’t had to deal with in the past are now projected to reach the big leagues this season. It’s tedious to keep teams up-to-date and to add these new players.

I needed to find a way to improve this process and to make everyone’s lives a little easier.

The Solution

The solution was to make the Player ID Map available in an online CSV file. One you connect that online file to your Excel spreadsheet, you simply have to right-click on the Player ID Map and hit “Refresh”. You will instantly get any update I’ve made.

Sounds amazing, right?

Major leaguers  have a purely numeric Fangraphs ID while minor leaguers have text in their ID.
Major leaguers have a purely numeric ID while minor leaguers have text in their ID.

The Problem

The fly in the ointment happens to be the way Fangraphs structures their player IDs. Major leaguers, like Jose Abreu, have a purely numeric ID. Whereas minor leaguers that have not reach the big leagues, like Yoan Moncada, have the text “sa” in front of a string of numbers.

The unintended consequence of importing the Player ID Map file is that because some IDs contain text, Excel will treat the ENTIRE imported column as text.

The problem is that reports you download from Fangraphs and then open in Excel treat the player ID column as numeric values.

Warning… It’s About to Get Technical

If you’re fine with the old Player ID Map and the fact that it doesn’t get updated very often, you don’t have to use the new one. The old one can be downloaded here and will still be updated periodically. You can stop reading this post and save yourself some sanity.

But if a little complication doesn’t scare you off and you see the value in being able to refresh the Player ID Map and get regular updates… Keep reading.

Text and Numbers Are Treated Differently

Excel and most other computer applications treat text and numbers differently. And this is a common problem with VLOOKUPS. So the number “15676” is not the same as a text string of “15676”. So in our VLOOKUPS, we need to make sure we are comparing numbers to numbers and text to text.

Consider the Error Message

The first step in resolving a VLOOKUP problem is to understand the error message you’re seeing.

The “#N/A” error is the most common VLOOKUP error. And it essentially means that a match was not found during the lookup.

There are two main reasons a match would not be found:

  1. The item (player ID) doesn’t exist where you told Excel to look for it
  2. Or you told Excel to look for the wrong data type (look for a text value in a list of numbers, or vice versa)

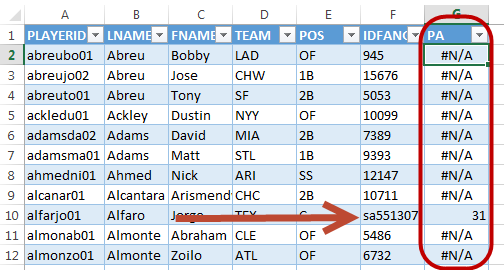
These are the downloaded Steamer Projections. Abreu's ID is the there. It's in the first column. Why isn't the VLOOKUP finding this???
Abreu’s ID is the there. It’s in the first column. Why isn’t the VLOOKUP finding this???

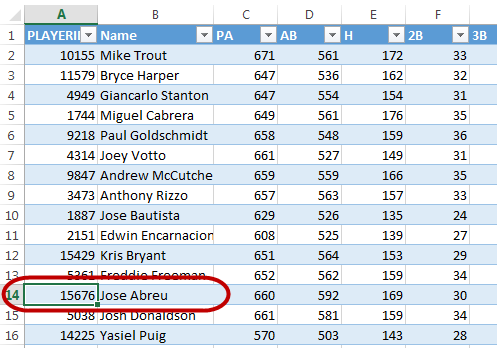
You can easily test the first error by manually performing the search yourself. Let’s walk through a hypothetical example with Jose Abreu. He’s a well known player. He’ll surely be in the Steamer projections I’ve downloaded.

I see from the data that Abreu’s Fangraphs ID is 15676. If I trace that through into the Steamer Hitter projections, I am able to locate Abreu. So why isn’t the VLOOKUP finding the same match?

Continue reading “An Important Lesson and How to Resolve VLOOKUP Errors”

Start Preparing for the 2016 Season

UPDATE – Projecting X 2.0 is available now! Click here for a special preview.

Whether it’s creating your own projections, averaging them with other popular projection systems, creating your own rankings and dollar values, or calculating points-league player values, now is the time to start preparing for the 2016 season.

Bundle Image smartfantasybbsgp_240 POINTS_BOOK AGGREGATOR

How to Project Plate Appearances

Projecting X Mike Podhorzer
Click here to create your own player projections.
Going through the process of projecting individual players is one of my favorite parts of the year. I started creating my own projections two seasons ago, using Mike Podhorzer’s book Projecting X.

There are parts of the projection process I feel very comfortable with. I can look at a player’s recent plate discipline, batted ball mix, and power ratios to arrive at an accurate projection for most of that player’s stat line…

But when it comes to projecting playing time, I feel like I’m throwing darts with a blindfold on. How can I realistically make a determination between 675 PAs and 690 PAs?

Until now, I’ve really just relied upon a player’s recent seasons and used qualitative information about injuries, role on the team, and playing time competitions to come up with an estimate for total plate appearances.

Thankfully, a reader of the site recently commented on a post I wrote about the effect of batting order on runs and RBI, and his question helped me arrive at the much more sound approach for projecting playing time I’m about to share with you. Here’s his question:

Interesting stuff. In your research, I am wondering if you happened to look at Team Runs/Plate Appearances on a per game basis?

That is, if a team scores Y runs in a game, what would you predict their Team PAs to be. Something like Y = Ax + B.

~DMM

That question got the wheels turning in my rapidly deteriorating middle-aged brain… There have to be better ways to think about playing time. And I certainly need to take the team’s overall run scoring into account.

Team Plate Appearances vs. Team Runs

To answer the question, I downloaded the last ten years of MLB team offensive stats from Baseball-Reference.com (click here to see the data).

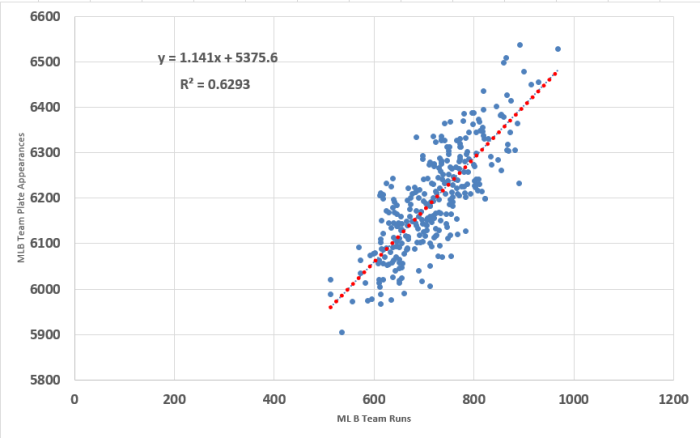
Then I created a scatter plot in Excel by graphing team runs against team plate appearances.

TEAM_RUNS_VS_PLATE_APPEARANCES

I’ve mentioned it many times on the site already. I’m no statistician. I don’t play one on TV. And I’m not pretending to be one on the internet. I am squarely in the area of having enough knowledge about statistics to offer no help but to only be dangerous. With that amazing qualifier I’ll try to explain what you see in that chart above.

Each of the blue dots represents one team’s season in the last 10 years (2006-2015). For example, the dot in the top right corner is the 2007 Yankees, who scored 968 runs (holy crap, A-ROD!).

The dotted red line represents a trend line or line of best fit. It’s the best estimate of the relationship between team runs scored and team plate appearances. The equation on the graph is the formula used to chart out the red line and is the exact answer to reader DMM’s question (where x is team runs scored and y is team plate appearances).

y=1.141x+5375.6

I suppose that could be helpful at the daily game level too. That equation would become y=0.007x+33.18 if you were trying to project a team’s plate appearances in an individual game (where x is runs per game, not season-long runs).

Projecting Individual Plate Appearances

That answers the original question. But I still wasn’t quite satisfied with stopping there.

Sure, it’s helpful to know that if I think Angels will score 700 runs that I should project that whole team for about 6,175 plate appearances (5,375.6 + 1.141 * 700 = 6,174.3). But what does that mean to Mike Trout if I think he will bat second in the lineup? And what if I think he’ll bat third?

Is there a way to add a third variable to the chart above? So we can see how leadoff hitters on teams scoring 700 runs have fared? Or how cleanup hitters on teams scoring 800 runs have performed?

The Data

Baseball-Reference has a really interesting split table that shows the hitting stats each team had from each spot in the lineup (click here to see Kansas City’s 2015 team split).

Kansas City Royals 2015 team batting splits

I downloaded that split table for all 30 teams for each of the last 10 seasons (300 CSV files!). You can see all the raw data here. Again, thanks to Baseball-Reference for making this data available.

Then I grouped the data by team runs scored, putting teams into categories of 500-549, 550-599, 600-649, 650-699, 700-749, 750-799, 800-849, 850-899, 900-949, and 950-999 runs. Here’s a table showing the number of teams in each of these categories for the AL and NL:

Runs Scored AL Teams NL Teams Total
500-549 1 2 3
550-599 2 7 9
600-649 19 34 53
650-699 23 33 56
700-749 33 43 76
750-799 30 25 55
800-849 19 9 28
850-899 12 4 16
900-949 3 0 3
950-999 1 0 1

Continue reading “How to Project Plate Appearances”