Create Your Own Fantasy Baseball Rankings: Part 5 – Understanding Standings Gain Points

Welcome to the fifth part of the “Create Your Own Fantasy Baseball Rankings” series.  If you missed an earlier part, you can find it here.  You can start at the beginning of the series or if you want to start here at Part 5, you can download the Excel file created during part 4 here.

Please note that this six part series has been adapted into a 10 part book that also shows you how to convert standings gain points into dollar values and how to calculate in-draft inflation.

A few notes about the series:

  • It was originally written before the 2013 MLB season.  The screenshots and player references you see might refer to things from that time frame, but the same approach will work today.
  • If you register as SFBB Insider, you can receive all six parts in a free, tidy, and easy-to-use e-book
  • Familiarity with Excel is recommended, but I do my best to explain all formulas and functions used
  • Some of the formulas used in the series do not work in Excel for Mac computers.  I apologize for this.  I don’t understand why Excel isn’t built to operate the same on that platform.

In this fifth part of the series we will discuss the concept of Standings Gain Points (SGP), a method of evaluating and ranking players.  At the end of this part, we’ll actually have some primitive rankings in place.  But we have quite a few concepts to go over before we  jump into Excel.

THE DIFFICULTY IN RANKING PLAYERS

Which player is worth more and should be ranked higher?

  • Player A – .280, 65R, 30HR, 95RBI, 0SB
  • Player B – .265, 100R, 10HR, 55RBI, 40SB

Or how about this?

  • Player A – .280, 65R, 30HR, 95RBI, 0SB
  • Player C – 5W, 40SV, 75SO, 2.50ERA, 1.10 WHIP

How do you rank different types of players (speed/average vs. power/RBI)?  Or even worse, how do you evaluate the worth of a hitter against the worth of a pitcher?  Enter the concept of Standings Gain Points.

STANDINGS GAIN POINTS – MY INTERPRETATION

The end goal of rotisserie fantasy baseball is to accumulate the most points in the standings.  The Standings Gain Points approach to valuing players is to convert a player’s statistics into the number of rotisserie points those statistics are worth.  

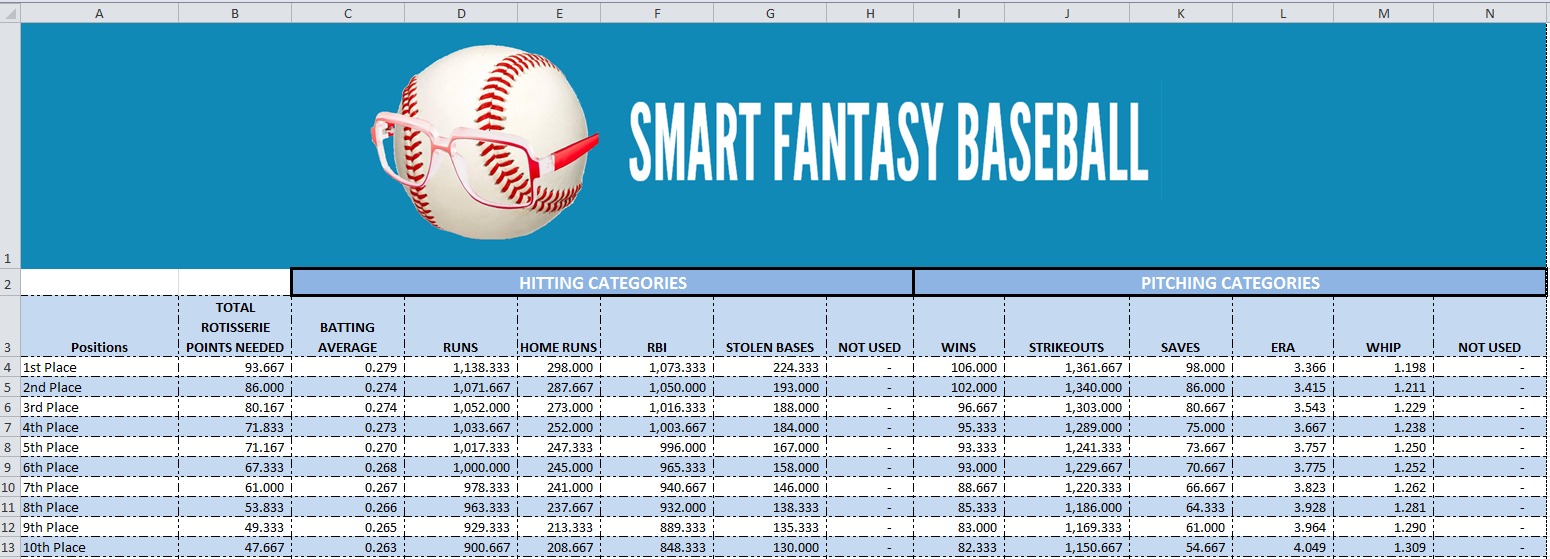
Let’s use some example statistics from a real 12-team 5×5 rotisserie league to illustrate:

POS HR RBI W ERA
1 291 1,054 108 3.359
2 287 1,027 107 3.365
3 281 1,017 93 3.477
4 274 1,003 92 3.678
5 272 998 88 3.815
6 267 973 88 3.857
7 263 968 84 3.946
8 261 965 82 4.096
9 244 945 82 4.097
10 239 921 81 4.177
11 234 920 81 4.284
12 191 792 78 4.361

Continue reading “Create Your Own Fantasy Baseball Rankings: Part 5 – Understanding Standings Gain Points”

Create Your Own Fantasy Baseball Rankings: Part 4 – Pitcher Rankings

Welcome to the fourth part of the “Create Your Own Fantasy Baseball Rankings” series.  If you missed an earlier part, you can find it here.  You can start at almost any part of the series, but it’s not recommended you start with Part 4 unless you are very familiar with the Excel functions listed below.  Part 4 is essentially reperforming step 3(which focused on hitters) for pitchers.  This post assumes you are familiar with the Excel functions and formulas used in Part 3.

Please note that this six part series has been adapted into a 10 part book that also shows you how to convert standings gain points into dollar values and how to calculate in-draft inflation.

A few notes about the series:

  • It was originally written before the 2013 MLB season.  The screenshots and player references you see might refer to things from that time frame, but the same approach will work today.
  • If you register as SFBB Insider, you can receive all six parts in a free, tidy, and easy-to-use e-book
  • Familiarity with Excel is recommended, but I do my best to explain all formulas and functions used
  • Some of the formulas used in the series do not work in Excel for Mac computers.  I apologize for this.  I don’t understand why Excel isn’t built to operate the same on that platform.

In this fourth part of the series we will use Excel formulas and functions to start pulling pitcher information (name, position, team) and projection information in order to eventually calculate our own rankings.

EXCEL FUNCTIONS AND FORMULAS IN THIS POST

Below are the Excel functions and formulas used in this post.  If you would like more background on them, please refer to Part 3 or ask questions in the comments area below.

  • VLOOKUP
  • TABLES and NAMED RANGES
  • COLUMN

STEP-BY-STEP INSTRUCTIONS

  1. Staying consistent with the hitting projections, I’m going to use the free Steamer projections from Fangraphs.
  2. To make the pitching projections easier to work with, convert the “Steamer Pitchers” tab to a “table” in Excel.  To do this, click anywhere within the data on the “Steamer Pitchers” worksheet.  Then locate the “Home” tab in the Excel menu system (“the ribbon”).  Click once on the “Format as Table” drop down, and then select your desired color scheme.Part 3-2You will then be prompted to verify the range of cells in the table and that your table has a header row (e.g. Name, W, L, ERA, etc.).  Check “My table has headers”.  Click OK.Part 3-3
  3. Because we’ll later be these pitcher projections into other worksheets, it will help us greatly if the fangraphs player ID is the first column of the table (you can use the VLOOKUP formula if the player ID is in the first column, otherwise you’re stuck using more difficult and/or multiple formulas).  Right-click on the top of the fangraphs player ID column (should be column X in the Steamer Pitchers projections).Cut_Pitcher_IDsPart 3-4.1Now right-click on the top of the player name column (column header “A”) and select “Insert Cut Cells”.  When you’re done, you should have the “playerid” column first and “Name” second.Part 4-1 Continue reading “Create Your Own Fantasy Baseball Rankings: Part 4 – Pitcher Rankings”

Create Your Own Fantasy Baseball Rankings: Part 3 – VLOOKUP, Excel Tables, Named Ranges

Welcome to the third part of the “Create Your Own Fantasy Baseball Rankings” series.  If you missed an earlier part, you can find it here.  You can start at the beginning of the series or if you want to start here at Part 3, you can download the Excel file created during part 2 here.

Please note that this six part series has been adapted into a 10 part book that also shows you how to convert standings gain points into dollar values and how to calculate in-draft inflation.

A few notes about the series:

  • It was originally written before the 2013 MLB season.  The screenshots and player references you see might refer to things from that time frame, but the same approach will work today.
  • If you register as SFBB Insider, you can receive all six parts in a free, tidy, and easy-to-use e-book
  • Familiarity with Excel is recommended, but I do my best to explain all formulas and functions used
  • Some of the formulas used in the series do not work in Excel for Mac computers.  I apologize for this.  I don’t understand why Excel isn’t built to operate the same on that platform.

In this third part of the series we will use Excel formulas and functions to start pulling player information (name, position, team) and projection information in order to eventually calculate our own rankings.  Strap in…  This is a long one.

Excel Functions and Formulas In This Post

Below are the Excel functions and formulas used in this part of the series.  If you’re already familiar with what these are, you can skip ahead. Continue reading “Create Your Own Fantasy Baseball Rankings: Part 3 – VLOOKUP, Excel Tables, Named Ranges”

Create Your Own Fantasy Baseball Rankings: Part 2 – Understanding Player IDs

Welcome to the second part of the “Create Your Own Fantasy Baseball Rankings” series.  If you missed Part 1, you can find it here.  You can start at the beginning or if you want to start here at Part 2, you can download the Excel file created during part 1 here.

A few notes about the series:

  • It was originally written before the 2013 MLB season.  The screenshots and player references you see might refer to things from that time frame, but the same approach will work today.
  • If you register as SFBB Insider, you can receive all six parts in a free, tidy, and easy-to-use e-book
  • Familiarity with Excel is recommended, but I do my best to explain all formulas and functions used
  • Some of the formulas used in the series do not work in Excel for Mac computers.  I apologize for this.  I don’t understand why Excel isn’t built to operate the same on that platform.

In this second part of the series we discuss what player IDs are so we can later use them to pull information within Excel.  You might have noticed the projection data downloaded from fangraphs in part 1 did not contain the player’s team or position.  But the downloads did contain each player’s fangraphs ID.

UNDERSTANDING PLAYER IDs

Are you familiar with Chris Young, the long-time Arizona Diamondback outfielder with a career batting average of about .240?  Are you familiar with Chris Young, the oft-injured extremely tall pitcher with a career ERA of 3.79?

Even if you’re not familiar with them, know that there are two baseball players of recent note named Chris Young.  Look at this chart:

Source .240 Hitting ID Tall Injured ID
Name Chris B. Young Chris R. Young
Baseball Reference youngch04 youngch03
Fangraphs 3882 3196
MLB 455759 432934
CBS 4898811 517762

Just like you have a unique Social Security Number or Employee ID associated with your name, baseball players have been given unique IDs from different organizations/websites.  These IDs give us a way to differentiate Chris B. Young from Chris R. Young.  The problem is that there is not an agreed upon ID for each player.  Each website or fantasy service uses their own ID.

We need a tool to translate the different player IDs from the various baseball services.  That’s where the Smart Fantasy Baseball Player ID Map comes in. Continue reading “Create Your Own Fantasy Baseball Rankings: Part 2 – Understanding Player IDs”

Create Your Own Fantasy Baseball Rankings: Part 1 – Download Free Projection Data

Welcome to the first part in a series of posts in which I’ll go through the process I use to create my own fantasy baseball rankings.  I’ll provide a link to download the rankings project (in Excel 2010 format) at each part of the series.  Please ask questions in the comments below so others can benefit from your questions.

A few notes about the series:

  • It was originally written before the 2013 MLB season.  The screenshots and player references you see might refer to things from that time frame, but the same approach will work today.
  • If you register as an SFBB Insider, you can receive all six parts in a free, tidy, and easy-to-use e-book
  • Familiarity with Excel is recommended, but I do my best to explain all formulas and functions used
  • Some of the formulas used in the series do not work in Excel for Mac computers.  I apologize for this.  I don’t understand why Excel isn’t built to operate the same on that platform.

In this first part of the series we’ll set up a new Excel file, download projection data, and do some basic formatting to make the file presentable.

Step-by-Step Instructions

  1. To start, create and save a new Excel file for this project.
    Rankings Part 1-1
  2. You could always pay for rankings or projections.  But this is a “DIY” project with the goal being to build your own rankings and not spend money in the process.  Fangraphs offers a “Projections” section that includes a number of free projection systems for download.  Choose your favorite projection system and use the link to “Export Data”.Fangraphs-RoS-Export
  3. The data downloads in CSV (comma separated value) format.  Locate the downloaded CSV file and open it.  It should open in Microsoft Excel.  Once the file opens, right-click on the tab and select the option to “Move or Copy…”
    Rankings Part 1-3
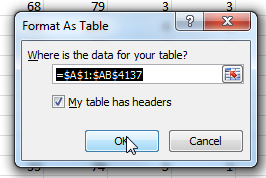
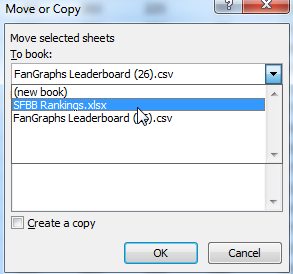
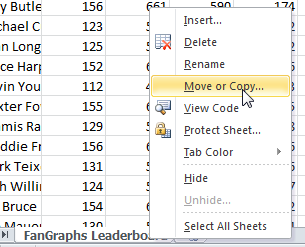
When prompted, choose your Rankings Excel file (saved in step 1 above) from the drop down menu.  Then hit “OK”.
    Rankings Part 1-4
  4. Any sheet downloaded from Fangraphs has the tab name “FanGraphs Leaderboard”.  Right click on the spreadsheet to give it a more meaningful name (like Zips Hitters). Continue reading “Create Your Own Fantasy Baseball Rankings: Part 1 – Download Free Projection Data”

Downloadable Tool – Calculate What It Takes To Win Your League

I’ve developed a much more refined tool to help calculate the number of rotisserie points it will take to win your league, as well as the statistics necessary in each category to achieve a certain place.

You can download the file here:  What It Takes To Win Calculator.xlsx

You must have Microsoft Excel 2007 or greater to use the calculator.  To use the calculator:

  1. After downloading the file, fill out the information requested on the “Answer These Questions First” tab (genius naming convention, I know).
    Answer These Questions First
  2. The questions can be answered using the drop down menus provided.
    Drop Down Menus
  3. Then proceed to complete all of the yellow hitter and pitcher stat tabs.
    Complete Hitter and Pitcher Tabs
  4. Follow the bold red instructions on each tab.  Also be on the look out for warnings for areas saying “DO NOT ENTER DATA BELOW”.  These are just warnings to ensure formulas work correctly and to prevent you from entering unnecessary data.
  5. Follow Instructions on Each TabAfter you’ve completed all the data entry into the yellow tabs, return to the “Results” tab to see the stats necessary to win your league.
    Results Tab
  6. The end result should be printer friendly, if you’d like to print it out for future reference.  Click on the image below for a larger view of the finished results.
    Printer Friendly Results

Features

The tool can accommodate the following:

  • Up to 15 teams
  • Up to 10 years of historical standings and statistics data
  • Up to 6×6 rotisserie categories (6 hitting, 6 pitching)
  • Hitting categories of BA, R, HR, RBI, SB, OBP, H, BB
  • Pitching categories of W, K, SV, ERA, WHIP, QS

Suggestions or Ideas for Improvement?

Please shoot me a comment and let me know what you think.  Let me know if you’d like to see any additional features or categories added.

As always, make smart choices.


Pitchers Due for a Higher ERA in 2013

Pitchers who significantly outperform FIP are very likely to see a rise in their ERA the following year.  With this in mind, let’s take a look at the pitchers who significantly outperformed their FIP in 2012.

Outperformed FIP by Greater than 0.70

Based on recent history, nearly all of these guys (or 94%) should see an increase in ERA for 2013.  With that said, I could see Hellickson being an exception.  He has consistently outperformed FIP over his short career:

SEASON ERA FIP
2010 3.47 3.88
2011 2.95 4.44
2012 3.10 4.60
Career 3.06 4.46

A counter argument to Hellickson being an exception is that he currently has one of the largest career differentials between ERA and FIP for a starter in the history of major league baseball (although I don’t think FIP is available into the distant past).  So he either has a very rare skill not measured by FIP or really is due to see his ERA increase and approach his FIP calculations.  A quick internet search turns up the fact that this is a heated debate surrounding Hellickson (there’s are interesting discussions of this very topic here and here).

Hellickson aside, the others display career ERA similar to career FIP (although Weaver has displayed an ability to exceed FIP) and are my targets for a higher ERA in 2013.  As a Tigers fan, here’s my favorite Jered Weaver (and Carlos Guillen) moment.

PLAYER 2012 ERA CAREER ERA 2012 FIP CAREER FIP
Jered Weaver 2.81 3.24 3.75 3.65
Jason Vargas 3.85 4.35 4.69 4.48
Matt Harrison 3.29 4.08 4.03 4.27

I’d look to see Weaver’s ERA rise toward the 3.50 mark and Vargas’ up toward his career 4.35 mark.  Based on career ERA and FIP of 4.00+ and his 4.03 FIP from last year, Harrison’s 3.29 ERA from last year looks to see the biggest rise of the group.

Once below the 0.70 threshold, the likelihood of an ERA increase is smaller, but still 74%.  And the list of names is definitely “fantasy relevant”.

If I Had to Cherry Pick Some Names

Let’s look at some of these more “fantasy relevant” names and their career ERA and FIP:

PLAYER 2012 ERA CAREER ERA 2012 FIP CAREER FIP
Matt Cain 3.40 3.27 3.40 3.65
Jordan Zimmerman 2.94 3.47 3.51 3.56
R.A. Dickey 2.73 3.98 3.27 4.23
Hiroki Kuroda 3.32 3.42 3.86 3.62
Johnny Cueto 2.78 3.57 3.27 4.03
David Price 2.56 3.16 3.05 3.48
Mark Buehrle 3.74 3.82 4.18 4.14
Jon Niese 3.40 4.06 3.80 3.78

Adding moves from the NL to the AL into the equation, Dickey and Buehrle become obvious candidates.  Besides moving from an offensively challenged division to the AL East, Dickey also posted career highs in K/9 (EXTREME career high, from 5.78 in 2011 to 8.86 in 2012) and LOB%.

I’m looking to find more incriminating evidence against, Buerhle, but it’s not jumping out at me.  He’s only ever had an ERA over 4.00 in three of his 12 seasons.  Although he did have the second best BABIP of his career (.270 last year, career .289).  I’d look for a rise, but nothing to significant.

Cuteo may have just had a career year.  He was great in 2011 too, but he pitched 60+ more innings in 2012.  His control improved dramatically and is on a continued downward trend.  It’s difficult to expect another career year, but you can’t ignore the trends.  I do expect his ERA to rise, but not significantly (3.00-3.10 range).

Zimmermann’s control regressed some in 2012 and he gave up more HR/9 and HR/FB in 2012.  But nothing too extreme.  Look for his ERA to rise into the 3.40-3.50 range, just to fall in line with career averages.

I love Jon Niese.  From 2011 going into 2012 he played the reverse role, with a 4.40 ERA in 2011 and a 3.36 FIP.  That flipped in 2012 as he posted a FIP similar to his career average but managed a career best ERA.  Also suggesting an increase in ERA is a career low BABIP number of .272 compared to a career BABIP of .311.  Look for an ERA in the 3.60-3.80 range.

Reactions?

Which pitchers do you think are do for regression?  On this list or otherwise.

Resources

Statistics courtesy of Fangraphs.

Welcome to Smart Fantasy Baseball

Welcome to Smart Fantasy Baseball.  The goal of this site is simple – to make you a smarter, better, more knowledgeable fantasy baseball player.  

If thinking about strategy, doing your own player analysis, creating your own projections, developing your own rankings, and diving into spreadsheets of baseball data are your thing, then I think you’ll enjoy the site.  Take a few minutes to look around.  If you like what you see and want more, register for the Smart Fantasy Baseball Newsletter and you’ll get instant access to two free e-books.

Listenings & Readings – Week Ending February 10th, 2013

I started keeping better track of what I’m reading…  A lot more content this week.

Listening

  • Baseball Prospectus “Towers of Power Fantasy Hour” with Jason Collette and Paul Sporer had their first base preview episode.  One main point they reiterated several times is that staying healthy and being in the lineup every day is a skill.  Keep this in mind when you’re looking over projections.  Players like Prince Fielder and Billy Butler who play 155+ games year-in and year-out are locked in production.

Reading

  • CBSSports.com released a 2013 fantasy outlook for each MLB team.  Each outlook includes a summary of offseason transactions, the projected starting lineup/batting order, projected rotation, a player to beware of, a breakout candidate, and some prospects to be aware of.  There is A LOT to read here.
  • Keith Law released an updated Top 100 prospects list (requires ESPN Insider).  For reference, Mike Trout, Bryce Harper, Matt Moore, and Manny Machado were the top four last year.  Those guys helped some fantasy teams last year.  You need to be familiar with the top names on this year’s list.

Baseball, But Not Fantasy Baseball Related

Geeky and Fantasy Baseball Related

  • I’m overwhelmed by but very interested in this series “Saberizing a Mac“, which takes you from ground zero to creating a database, obtaining data, and running baseball database queries from your mac.  

Understanding DIPS and FIP

Defense Independent Pitching Statistics (DIPS)

“There is little if any difference among major-league pitchers in their ability to prevent hits on balls hit in the field of play.” – Voros McCracken, Pitching and Defense

McCracken’s article mentioned above was extremely influential in pioneering a new wave of baseball statistics.  McCracken began the process of separating pitching statistics from the defensive players behind the pitcher.  The question being, “Can we measure the effectiveness of a pitcher by using statistics that only a pitcher can control?”.

In attempting to answer this question, McCracken created Defense Independent Pitching Statistics, or “DIPS”.  A key finding in McCracken’s work is that a pitcher’s walk rate, strikeout rate, and home run rates were somewhat consistent from year-to-year, while BABIP was not.

If a player can consistently maintain walk rates, strikeout rates, and home run rates, any fluctuation in statistics like ERA or BABIP must be influenced by defense and luck, which are factors outside a pitcher’s control.

With this in mind, let’s examine the five possible outcomes for a given pitcher vs. batter plate appearance:

  1. Ball hit into play for a hit
  2. Ball hit into play for an out
  3. Home run
  4. Strike out
  5. Walk (or HBP)

Of these categories, items one and two are clearly dependent upon defensive players and luck (is the frozen rope hit directly at the third basemen or six inches out of his reach?).  Items three, four and five are completely independent of defensive players.  And while some luck is involved in home run rate, the pitcher’s skill is a factor as well (some pitchers give up a lot of home runs, some can prevent them).

That’s where FIP comes in.  No not that FIP.  This one.

Fielding Independent Pitching (FIP)

FIP, developed by Tom Tango, attempts to evaluate pitchers only on factors under their control.  Or independent of fielding.  Tango’s calculation uses the measures that are significantly within a pitcher’s control (HR, BB, K) to approximate what the pitcher’s ERA “should” be.  FIP is an easy stat to use and calculate because it has a simple calculation:

FIP = (13 * HR + 3 * BB – 2 * K) / IP + 3.20

The addition of 3.20 is to more closely align FIP with ERA.  Otherwise you end up with numbers like 0.50 or 0.77.

FIP turns out to be an incredible predictor of ERA (check out this analysis of the top 10 ERA and FIP leaders since 1962 by Tom Tango).

Is FIP Always an Accurate Measure of ERA?

No.  In an individual season, ERA and FIP can differ significantly (up to 1.00).  Further, some pitchers display a perpetual difference between ERA and FIP.  For example, Zack Greinke has a career ERA of 3.77 and a career FIP of 3.45 (his actual results are worse than expected).  While Mark Buehrle has a career ERA of 3.82 and a career FIP of 4.14 (better than expected).

A significant difference between ERA and FIP over the course of a lengthy career suggests other factors at play that FIP does not account for.  Perhaps there is some intangible quality that Grienke does not possess that leads him to have an ERA greater than his FIP.  Maybe Mark Buehrle has this quality and it allows him to regularly outperform his FIP projections.

How Do I Apply FIP to Fantasy Baseball?

Granted, this Harball Times article is from 2005.  But the results are impressive.  Of the 22 pitchers whose ERA exceeded their FIP the most, 18 saw their ERA decline the next year (and two didn’t even play!).  Of the 30 whose ERA was lower than FIP, 23 saw their actual ERA increase.  Applying this, we can look for pitchers whose FIP varied greatly from actual ERA to identify candidates likely to improve upon last year’s ERA or to identify those likely due for an increase in ERA.

What Do You Think?

Please leave your comments below.  Have you added FIP to your repertoire yet?

Thanks for reading.


FURTHER READING

Tom Tango, the creator of FIP, is also well known for The Book: Playing the Percentages in Baseball. This is recommended reading if you’re looking to understand optimal baseball strategy.

RESOURCES