How Do I Calculate SGP for OBP?

I frequently get asked how to calculate standings gain points for the OBP category.  In this post I’ll give you an example of how to perform this calculation .

Full disclosure:  I don’t play in any OBP leagues.  

I know, I know.  You just lost a ton of respect for me and you’re considering leaving the site.  But I’m here to serve, so let’s figure this out together.

Before we begin, special thanks are in order for reader Matt who graciously agreed to fill out the “What It Takes To Win Your League Calculator” with the last four years of history for the OBP category in his league.  You can see the data for ten teams listed below.

Standings_Gain_Points_OBP

How Many OBP Points Move You Up One Spot In The Standings?

Over the last four years, an average of .356 won the category and an average of .335 finished 10th.

.356 – .335 = .021 total spread between 10 teams

We have the data for 10 teams, meaning there are 9 spots you can move up in the standings by moving from .335 to .356 in team OBP.

.021 / 9 = .00233

On average, increasing your team OBP by .0023 points will result in you climbing one spot in the standings.

But I Play In A 12-Team League, Can I Use This Figure?

If you have an established league history with historic standings available to you, you can always calculate this yourself based upon your league’s specific history.

I don’t have specific evidence to support this, but I would venture a guess that limiting your SGP calculations to the top 10 out of 12 teams might be more beneficial than using all 12 teams.  This would minimize or eliminate the effect of teams that lose competitiveness or that tank the season.

What Formula Do I Use To Calculate The SGP For A Given Player?

Recall from Part 5 of the “Create Your Own Rankings” series, that you determine the SGP for a ratio stat, like OBP, by removing the effect an average player has on an average team, and then inserting the player you are ranking into the equation. Continue reading “How Do I Calculate SGP for OBP?”

Taking Your Draft Spreadsheet To The Next Level

In this post I’ll show you how you can take a boring black and white spreadsheet and convert it into a visually meaningful piece of art in less than 10 minutes.

An important factor in being a skilled drafter is the ability to remain cool and calm in pressure situations. There may also be opportunities to intimidate some of your opponents during the draft, to give them the impression that you are highly prepared and ultimately familiar with the player pool and your own drafting strategy.

Nothing can accomplish these things better than a fancy color-coded spreadsheet.

There may be an element of hyperbole in that statement. But we have all been there. It’s late in the draft, you’ve already wasted 60 of your 90 second allotted time and you’ve just made the decision that you need to draft a second basemen with some power but that won’t kill you in batting average. Or you need a pitcher with good strikeout totals that won’t kill you in WHIP. Or some obscure shortstop is thrown out for bid in the auction and you can’t remember if he will help you with reaching your target goal in stolen bases.

Enter Conditional Formatting in Excel

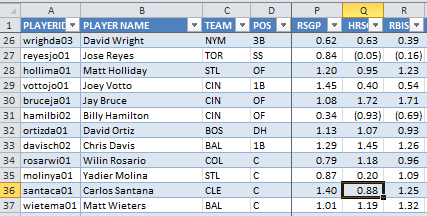
Conditional Formatting in Excel allows you to give visual meaning to a mass of boring looking numbers that can be hard to interpret all at once.  Let’s face it, while looking at the spreadsheet example in the image below it is not easy to quickly make sense of the numbers.

Conditional_Formatting_Example

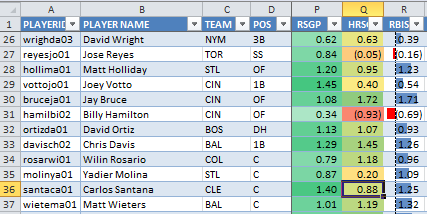
But if I take this same area and apply a few of the different conditional formatting rules to it, you can much more quickly make sense of what you are seeing:

Conditional_Formatting_Example2

In the “RSGP” column I have applied a rule in which you select two colors.  One color represents the highest value in the data selected and the other color represents the lowest value in the data selected.  I chose a standard green color for the highest value and white for the lowest.  Excel then automatically provides shades between white and green to each player’s “RSGP” based upon its value relative to all the other players in the list.  Whether you agree with me or not, I’m down on Billy Hamilton’s ability to stick at lead off for the entire year, and his run projection is the lowest of anyone captured in the screenshot.  So he’s the closest to white.  While Votto has the highest “RSGP” in this small group of players, so he’s shaded closest to green.

The “HRSGP” column has a rule using three colors.  Green is still used for the values that are greatest in this column.  Red is used for the lowest values,  And Yellow is used for values near the 50th percentile of the group.  Again, Excel automatically shades ever player’s value according to this set of instructions.  You simply select the three colors and Excel does the rest.  Here you can see Billy Hamilton is projected to be very low in “HRSGP”, while Jay Bruce and Chris Davis are much higher.  These two illustrate an important concept too.  I have Bruce projected to hit fewer home runs than Chris Davis, but Bruce comes out with a higher “HRSGP” based upon the positional replacement level adjustment under the SGP method.

The “RBISGP” is using data bars to depict the value of each player’s RBI compared to the group.  Not to keep piling on Billy Hamilton’s lack of hitting prowess, but you see he has a red bar pointing to the left, in his “RBISGP” column.  This indicates the magnitude to which his RBI projections are below 0.00 SGP.  Jay Bruce, right above him, has a very strong RBI projection and a blue shaded bar depicts this.

Conditional_Formatting_Example3

This Seems Way Too Complicated

It’s really not.  You can add this to your draft spreadsheet in under 10 minutes.

Things To Consider Before We Start

In the step-by-step instructions below, I apply conditional formatting to a player’s standings gain point (SGP) figure for each individual category (e.g. HR, BA, R, etc).  I choose to do this because after following the “Create Your Own Fantasy Baseball Rankings” approach, the final SGP figure for any player includes an adjustment for replacement level at the position.  This means that 15 HR from a 2B are valued more than 15 HR from a 1B.

The other benefit of applying the formatting to the SGP columns is that rate states like BA, ERA, and WHIP will be weighted appropriately.  An OF that might hit .300 but only get 200 PAs isn’t really helpful to our team BA.

There is an argument to be made that you would want to apply conditional formatting to a player’s raw statistics instead of the SGP figure.  After all, if you’re trying to draft players in order to reach a targeted goal (like 250 HR), you might be more interested in a 1B projected to hit 18 than the C projected for 17, even though those 17 from the C are more “valuable”.

Anyways, that’s beyond the scope of this post.  I’m just here to add fancy colors to your spreadsheet right now.  Just know that you can do this using a player’s raw projections even if you haven’t worked through the “Create Your Own Fantasy Baseball Rankings” series.

Step-By-Step Instructions

Continue reading “Taking Your Draft Spreadsheet To The Next Level”

Now That Football Is Officially Over…

WARNING:  This post was originally made prior to the 2014 MLB season.  The Projecting X Spreadsheet Template has since been improved!  For more information, please go to smartfantasybaseball.com/bundle.

If you’re looking for a project that will prepare you for the upcoming season and teach you how to create your own fantasy baseball projections, look no further.

I’ve created two videos that demonstrate Mike Podhorzer’s “Projecting X” and the additional materials I have created to go along with it.

First, some practical examples of how easy it is to update your own formula-driven Excel projections:

Second, a close up look of all that is included in “the bundle”:

Like what you see? Interested in supporting this site? Please click here.

How To Improve Your Fantasy Baseball Knowledge

Justin Timberlake has come a long way. He started out as a dorky little kid on the Mickey Mouse Club, “progressed” (notice the strategic use of quotation marks) to this, started dating the hottest celebrities (at the time), began appearing in award winning movies, and now he’s winning solo recording artist honors.

This example of Timberlake was mentioned by Marc Ecko, the billion-dollar fashion mogul, in a podcast interview about what it takes to be great (click here to listen). He used this illustration of Timberlake to point out that nobody ever really starts out great. It’s a process. To paraphrase what Ecko said:

The key to greatness is iteration.

According to Wikipedia:

Iteration is the act of repeating a process with the aim of approaching a desired goal, target or result.

Said another way, it’s about making continuous improvement over time. Small improvements. But a lot of them. Not necessarily dramatic leaps forward.

Timberlake didn’t just snap his fingers and go from scrawny Mickey Mouse Club kid to Music-Superstar-Hollywood-Actor-Junk-In-A-Box-Heartthrob. It took him years to get there.

Every season. Small incremental improvements. For many seasons.

If you start applying this concept now and master a couple new fantasy baseball concepts each year, think how good you will be five or even ten years from now.

Are You Improving?

One reason I enjoy having this site is that it holds me accountable to improve at this “craft” of playing fake baseball games.

I have had seasons in the past where I didn’t seek to improve knowledge or understanding of the game. But now I have reached a point where I try something new every year.

I make my draft preparation a little more involved. I add new features to my spreadsheet. I  enhance my rankings formula. I consider other ways of ranking players. I just developed my own projections for the first time. I read books about (real) baseball, Sabermetrics, technology, and even fantasy baseball.

So What Are You Doing To Improve This Year?

There are many things you can do. Here are some things that come to mind Continue reading “How To Improve Your Fantasy Baseball Knowledge”

How To Track Drafted Players In A Spreadsheet

I’ll paraphrase a reader question I recently received:

Hey, you with your big fancy spreadsheets.  I need a way to easily hide the players that have already been drafted so I don’t waste time digging around in a bunch of players that are no longer available.  Have any tips?

– Bill

Great question.  Let me show you how I do this.

But First…

We have three key Excel concepts or features you should understand.  If you’re already familiar with these, just skip down to the step-by-step instructions below.

  1. Named Ranges
  2. Data Validation
  3. Filtering

Named Ranges

Excel allows you to create names for groups or blocks of cells.  Once established you can use this name in formulas instead of having to fully spell out the entire range of data again.  I find it a lot easier to deal with a name like “TeamNames” than it is to explicitly specify the area of a range like “Settings!$A$1:$A$10”.  Named ranges are a lot easier to remember and a lot less likely to result in errors.

Data Validation

Data validation ensures that information entered in a cell or calculated by the Excel fits specified criteria.    You could validate that information entered in the cell is a date or is larger than 0, for example.

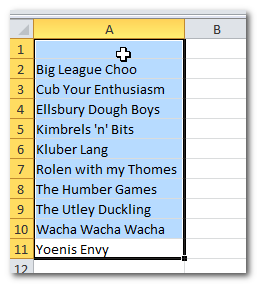
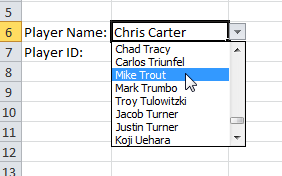
In the example below we will create a drop down menu that lists each team in your fantasy league and validates that the selected value is spelled correctly and corresponds to a team in your league.

Filtering

Filtering is a function in Excel that allows you to hide entire rows of data that don’t meet certain requirements.  In this example we will filter the list of players to hide players that have been given a team (they have been drafted).

Step-By-Step Instructions

The following instructions will take you through the process of adding a column to track which players have been drafted and which team in your league selected each player.  We will create a drop down menu that lists all teams in your league and use this to document who was drafted and by what team.

These instructions assume you have some kind of a starting spreadsheet containing projections and rankings already.  If you don’t have such a starting point, skip to the end of this post for information on how to get here. Continue reading “How To Track Drafted Players In A Spreadsheet”

Web Queries Part 2: How To Make a Dynamic Excel Web Query

We’re about to take web querying to the next level.  If you’re not familiar with web queries or if you missed our first discussion, you can brush up on Excel web query basics in Part 1 the Web Queries Series here (ha, that rhymes).

This will also make more sense if you’re familiar with the concepts of player IDs and website URLs discussed in this post.

The Weakness In Our First Query

You might recall that our first web query was specifically linked to Jose Fernandez’s player page at BrooksBaseball.net.  This is a great way to pull his specific pitch mix into an Excel file.  But it’s also pretty limiting that we can only pull in Jose Fernandez’s statistics and would have to create a new query to look up another player.  At that point it’s faster to just go to BrooksBaseball.net and start searching for players manually.

What is a Dynamic Web Query?

A dynamic query would be designed in such a way so that we only have to initially set up one query.  That query is not static, linked to one specific page or player, it’s dynamic, meaning it is linked to an input that can change.
Said another way, instead of linking the web query to player ID “11530“, link the web query to a specific cell in Excel.  Then whatever player ID is typed into that cell will be used in the web query.

A New Example

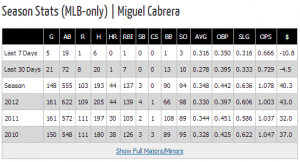
Instead of linking to BrooksBaseball.net, we’ll link to the player pages at Razzball.com. miguel_cabrera_razzballIf you haven’t checked them out, these player pages over are an incredible resource.  Take a look at Miguel Cabrera’s page using this link:

http://razzball.com/player/1744/Miguel+Cabrera/

And just to illustrate something about the URLs at Razzball, try this link:

http://razzball.com/player/1744/

They load to the same page.  The player’s name is not necessary for the page to load.

Stop Blabbering And Asking Me To Read Things.  Show Me How To Do This.

Sorry about that.  Video is more conducive to understanding this dynamic web query example.  Here you go:

Have Any Questions?

Don’t just watch the video.  Give this a try.  You could use this to more easily do projections, evaluate trades, set the ideal daily fantasy lineup, and much more.

If you like getting your hands dirty in Excel and doing player analysis like this, sign up for the Smart Fantasy Baseball newsletter where you’ll get more great ideas like this.

Be smart.

Web Queries Part 1: How to Make Your First Excel Web Query

Did you know there is an easy way to grab baseball statistics from web pages and easily pull the data into Excel?  And if that same data on the web changes, the new information will automatically pull into your Excel file.  The function in Excel is called a “web query” and it’s pretty amazing stuff.  I’ll show you how to make your first web query in the post to follow

Credit Where Credit Is Due

I recently learned of web queries when I was looking into features in Excel 2013, and more recently I came across the idea being applied to baseball statistics in Joseph Adler’s book, Baseball Hacks: Tips & Tools for Analyzing and Winning with Statistics.  If you enjoy the Excel and data analysis articles here at SmartFantasyBaseball.com, you need to get your hands on a copy of “Baseball Hacks”.  I cannot recommend it enough.  Web queries are only one of the 75 different “hacks” in the book.

Please note that I only recommend resources that I think are extremely valuable and that I use myself.  The links to Baseball Hacks above are affiliate links, through which I earn a small commission if you were to purchase the book. The book will cost you the same if you directly go to Amazon and search for it. If you prefer a generic link through which I receive no benefit, use this.

Acquire A Target

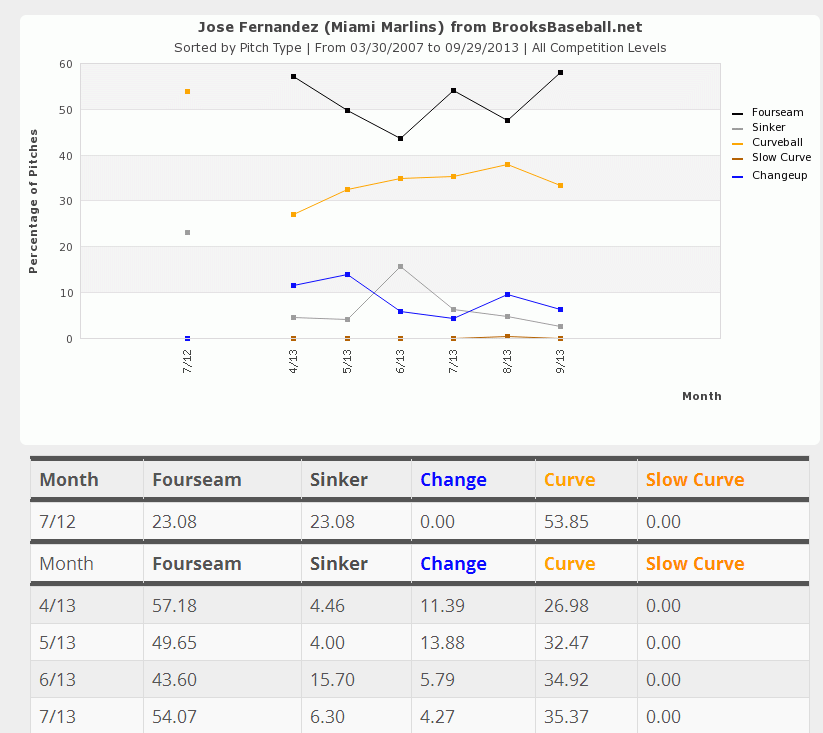
The first thing you’ll need to do is identify a web page that has the data you want to grab.  The information has to be in a table format.  For this first example we’ll go to one of my favorite sites, Brooksbaseball.net, and pull in the pitch type usage information for Jose Fernandez.

If you visit the link above or look at the image below, you can see the percentage use of each type of pitch is presented in a tabular format (below the graph).  It is this table that we will now link to an Excel file.

ImportHTML23
Image and pitch data courtesy of BrooksBaseball.net

Making Your First Web Query

You can watch the video or refer to the written step-by-step instructions below. Continue reading “Web Queries Part 1: How to Make Your First Excel Web Query”

How To Gain Rotisserie Points On The Last Day Of The Season

A common piece of preseason draft preparation advice is to know your league’s rules, to make sure you’re properly valuing players.  There are also some very important rules to keep in mind for the end of the season.  Rules a lot of fantasy managers aren’t aware of. Rules that will allow you a competitive advantage if you know them and how to apply them to your benefit.  

If you play in a rotisserie league on any of the major fantasy baseball providers (Yahoo!, ESPN, CBS), your league likely has some form of an innings pitched limit. Understanding how this limit is applied can allow you to gain an edge in the starting pitcher counting categories of wins and strikeouts.

The Rule

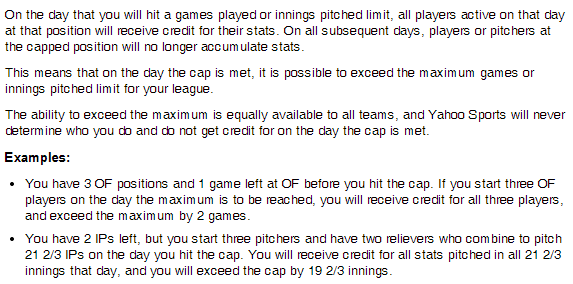
For each of these major websites, the innings pitched limit is applied at the end of the day on which you surpass the limit.  This means that you can actually surpass the limit established in your league rules by loading up on starting pitchers the day you expect to reach the threshold.

An Example

Assume your league has a 1,500 innings pitched limit.  During the final week of the season you sit at 1,490 innings pitched.  You then drop any pitcher not starting the next day and pick up a streaming option that does pitch.  You do this with all seven pitching spots in your line up.  The next day your seven starters pitch a combined 45 innings, strike out 38 batters, and earn four wins.

In this example, this strategy allows you to exceed the innings pitched limit by 35 innings, accumulating 25+ extra strikeouts and a few extra wins.  Depending on the standings in your league, this can most certainly allow you to gain a few additional points in the standings…  And maybe even win your league.

Applying This In Practice

This will be much easier to implement in daily transaction leagues where you can drop all your players on a given day and pick up tomorrow’s scheduled starters.  But you could conceivably do this in weekly lineup leagues if you plan far enough ahead.

Additionally, it only will make sense in certain scenarios.  Review your league standings to determine if you have points to gain in wins and strikeouts.  Weigh these potential points against any possible lost points if you suffer a bad ratio day (ERA, WHIP).

Thankfully it is much more difficult to move ratios significantly this late in the season.  In fact, if you have enough cushion in ERA and WHIP, consider only picking up strike out specialists, regardless of their ratios.

You need to carefully approach the innings limit first.  Be cautious not to accidentally go over before you can take full advantage of this.  I would recommend trying to get within 10 IP of the full limit.  Getting any closer could be dangerous.

Avoid a Backfire

Perform this strategy as close to the end of the season as possible.  Many managers won’t be aware of this rule and doing it too early will allow others to recognize what you are doing and open you up to a similar response, wiping out the advantage you created.  Further, you may be dropping some very good pitchers in order to pick up streaming candidates.  Trying this before the last several days of the season will allow opponents to pick up these very good players and potentially use them.

Don’t Believe Me?

Check out the rules web pages for your league host below.

Yahoo!

loophole2

ESPN

Note that ESPN has a games started limit, not an innings pitched limit.  But the same principles apply.

loophole1

CBS 

loophole3

Conclusion

This is an easy tactic to employ and you’re leaving points on the table if you don’t try it. Granted, it doesn’t make sense if you stand to lose points in ratios or if you face keeper-league ramifications.  But if you could use an extra 20 strikeouts and a couple wins, you can’t go wrong.

Make smart choices.

Are you following me on Twitter?

Case Study: How To Assess Your Rotisserie League Standings

The case study below looks in detail at how to perform a review of your league standings.  This specific case study is written from the perspective of performing this review in late August, but reviewing and assessing your league standings is a valuable exercise to perform at any point in the season.

This review will guide the moves you make throughout the season.  It’s absolutely critical to have an in-depth understanding of the league standings.  This is not a simple exercise.  It will take time.  But that’s exactly why it’s advantageous and why it can be an advantage for you.

It’s Late August.  You’re In The Middle Of The League Standings.

How many rotisserie points can you legitimately expect to gain in the standings at this point of the season?  If you think you’re out of it, or don’t think you can catch the leaders because you’re in fifth place, I’d encourage you to take a closer look.  You might be surprised at how significantly things can still change.

The Standings

For the rest of this case study, assume the standings shown in the table below.  Let’s look at things from the perspective of the team in fifth place, E.A.B.O.D.  Does this team have a chance to catch the leader?

The first thing worth noting, besides the fact that I play in a nine team league (I’ve been trying to tell you I’m just a “regular guy”), is the first place team has a sizeable lead over the rest of the pack and sits at 68.5 points.  Then things are tightly bunched with four team near the mid-50s.

Standings1

This Is Just A Battle For Second PLace, Who Cares

We’ll take a look at if catching the first place team is possible in a moment.  But even if this is just a four-team battle for second place, taking this battle seriously, applying a well-devised strategy, and making a full-fledged effort to pass the current fourth, third, and second place teams is a valuable exercise.  What if next year it’s a four-team race for first?  Or even a two-team race?  If you’re able to win a four-team race over the last month of the season, next year’s two-team race will seem simple.

I got the idea for this case study while listening to Todd Zola on the August 9th edition of the BaseballHQ Radio Podcast.  His point was that it really doesn’t matter what place you are in the standings.  The exercise of going through a review of your team and the league standings in order to gain a few points is great practice.  Always seek to improve your team.  You’ll learn a lot from these seemingly unimportant battles.

Let’s Take A Closer Look

Remember, with roughly one month to play, we currently sit in 5th place at 52 points.  If we are to somehow pull this miracle off, we would need to reach 69 points, meaning we must somehow climb 17 points in the standings.

The best way to figure out how many points are possible?  Go category-by-category through the standings and figure out what points can easily be earned and those that could be earned with a little luck.  It’s also worth looking at the categories in which we could lose points (easily or due to bad luck).

Starting with runs, we’ve got a total of 830 runs to this point in the season.  Trying to be realistic about how many runs can actually be made up in about one month, we’ll say making up one run a day is possible, but not likely.  More likely, making up 15 runs over the next 30 days is a realistic possibility.  So anyone within 15 runs of our 830 total can be caught, giving us another rotisserie point.

Looking at the actual standings below, only one team is between our 830 runs and the attainable 845 (that’s SpartyOn with 841).  One additional team, The Naturals, is within 30 (at 857 runs to our 830).

Standings2

So that’s one standing point we can realistically gain (catching SpartyOn) and one more we could possibly gain, but it’s unlikely (The Naturals).  Note, if you’re also concerned about being caught in the standings, tracking the points you could potentially lose is another valuable exercise.  There is one team hot on our tails, with 827 R, and two others within 30 runs (805 and 802).

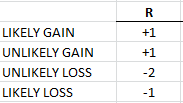
Summarizing the points we could gain or lose:
Standings13

Now extend this exercise out to the remaining hitting categories.  We’ll say anyone within 12 HR can realistically be caught and within 20 could potentially be caught.  Within 15 RBI can legitimately be caught and 30 RBI is possible but unlikely.  10 SB can reasonable be caught, 20 would be possible but unlikely.  And within .003 BA points can be caught, .006 would be possible but unlikely.

Standings3

Pitching Is A Little More Complicated

This particular league happens to have an innings limit of 1,550 innings.  Innings can be manipulated more easily than games played by hitters.  A team could theoretically start streaming a multitude of pitchers and easily increase innings in the short-term, whereas the limited number of lineup spots and days off for hitters prevents you from increasing at bats in the short-term.  This leads to potentially distorted pitching standings.

Look at the current standings below.  Take for instance, The Heat in seventh place.  The team is clearly ahead of everyone else’s pace for innings pitched and will hit the 1,550 cap soon.  The 1,185 strikeouts in 1,364 innings isn’t nearly as impressive as the 1,145 strikeouts the Warriors (eighth place) have in 1,132 innings.  The Warriors need only 40 strike outs in the next 200 IP to catch The Heat.  So we have to take the innings pitched distortion into account.

Standings14

The innings pitched distortion can only affect raw counting stats like W, SV, and K.  Pitching more or less innings can’t directly affect rate statistics like ERA and WHIP.

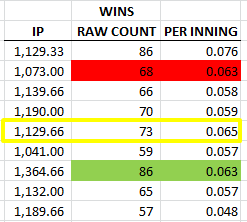
Looking more closely at wins, we can calculate the rate at which teams are earning wins by dividing wins by total IP.  This gives us “Wins per inning”.  Granted, this is an odd statistic and it’s not useful for many things, but it will help us remove the distortion caused by teams simply having more innings pitched than others.

Our hypothetical team in this case study is highlighted in yellow with 73 wins, or 0.065 wins per IP.  Looking at other teams, we actually have a higher wins per inning than the team with 1,364 innings pitched.  Even though that team has 86 wins, we are earning wins at a faster rate (0.065 vs. 0.063).  Theoretically we can pass this team simply by continuing to start our current pitchers.  Once we get to 1,364 innings, we should have more than 86 wins.

The other team with 86 wins (in 1st place) can’t be caught.  We have nearly the same number of innings (1,129.33 vs. 1,129.66), but they already have 86 wins to our 73.  And because we are in third place for wins (86, 86, then our 73), there are no more points to be made up in wins.
Standings6

Continue reading “Case Study: How To Assess Your Rotisserie League Standings”

Use PITCH f/x Data To Identify Potential Breakout Pitchers (Part III)

If you’ve made it to Part III in the search to identify potential breakout pitchers, congratulations.  If you missed them, you can find Part I here and Part II here.

Enough Talk, Where Is This List Of Potential Breakout Pitchers?

I’ve uploaded an Excel file to Microsoft Sky Drive.  You can edit, view, or download the file for your own uses.  It’s mostly the same data from the YouTube video, but I added a lot of bells and whistles.  A red cell indicates a pitch that has declined in use from 2012 to 2013.  A green cell indicates a pitch with more usage.  The color intensity indicates the magnitude of the change.  The links to the right take you directly to that specific player’s page on BrooksBaseball.net.

PitchClass14
Click on the image to be taken to the editable file (you can edit or download for your own use).

Disclaimer #1

Keep in mind, I started this analysis on June 24th, 2013.  So if you’re finding this information after that time, you may want to double-check the usage graphs for any pitcher you’re researching.  But I’ve tried to document the approach to doing this research in the video and other parts of this series.  You can perform this research at any time (it would be great if we could get monthly usage reports from Fangraphs, then we could do this in the offseason to identify pitchers who started to change their mix late in the season).

Disclaimer #2

You saw from Part II of this series that these changes in mix have to be taken with a grain of salt.  And even after you’ve verified that there is indeed a change in pitch mix, you still need to go review the effectiveness of the pitches being used more frequently.  I wish I could go through each of these pitchers and break them down for you.  But it’s just not practical (my two-year old and four-year old don’t find PITCH f/x research very entertaining).  Hopefully I’ve equipped you with the tools you need to go analyze these pitchers more closely.

For pitchers on your team, check them out.  If you’re thinking of picking up a free agent, check him out.  If your pitching staff is terrible and you need to find the next big ace, check them all out.

Conclusion

Granted, it’s a small sample size.  But I’ve done a deep look in this fashion for Edward Mujica, Max Scherzer, and Alexi Ogando.  And all show promising results.  There will certainly be pitchers that change their mix and it has little effect on their end results.  But this seems like a promising exercise.

PLEASE LET ME KNOW WHAT YOU THINK Or If You Have Questions

I realize this is quite involved.  It’s certainly more difficult than reading the weekly pickups columns that are out there.  But anyone can read those and snag players just as easily as you can.  This process will put you ahead of the curve, give you players to monitor, and give you first crack at picking them up.

Thanks and be smart.