How To Add Positional Ranking To Your Spreadsheet

I just came across an interesting use of an Excel formula that will let you easily determine what a player’s ranking is at their given position (1B-1, 1B-2, 1B-3, etc.).

Here’s an explanation that might show what I’m talking about.  You’re scrolling through your huge list of ranked hitters (see image below).  You have them sorted by Total Standings Gain Points (column V) in descending order.

You see Edwin Encarnacion’s name pop up in row #38.  You know he’s a first basemen, and you can pretty easily determine that he must be the #37th ranked player (by showing up on row 38).  But now you want to know where he ranks amongst only other first basemen.

Without_POS_Rank

In this post I’ll show you a formula we can use to get our spreadsheet to look like this (look at column W):With_POS_Rank_Edwin_Encarnacion

I’m a Moron

I got nearly to the end of this post when I started to think it was weird that Encarnacion was ranked #37, Starlin Castro #32, and Paul Goldschmidt #21. Turns out I used a rankings file from the 2013 preseason for all the screenshots…

I decided against starting over because it’s not the player names that are important, we’re mostly looking at a new formula. And I found it pretty interesting and thought provoking to look at these old lists and see names like Nori Aoki and B.J. Upton so high.

Excel Formulas Used In This Post

Using the “&” to Build Text

As you can see from the image above, we’re trying to take each player’s position (e.g. “1B”) and then add a dash and then the player’s positional ranking (e.g. “1B-8” for Encarnacion).

You can use the ampersand (would you know what that was called without “Wheel of Fortune”?), in an Excel formula to add text from different columns.

A real practical application of this is to build a player’s full name (e.g Billy Hamilton) from their first name and last names being in separate columns.  Here’s an example:

Billy_Hamilton_Jose_Altuve_Craig_Kimbrel_Madison_Bumgarner Continue reading “How To Add Positional Ranking To Your Spreadsheet”

Designing Reusable Fantasy Baseball Spreadsheets

Why do your spreadsheets have so many tabs?

When you’re building a rankings spreadsheet, why don’t you just build the calculations right on the projection tab?

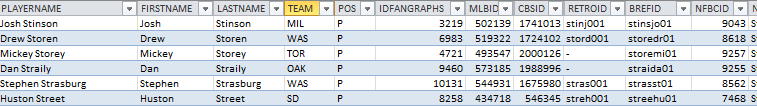
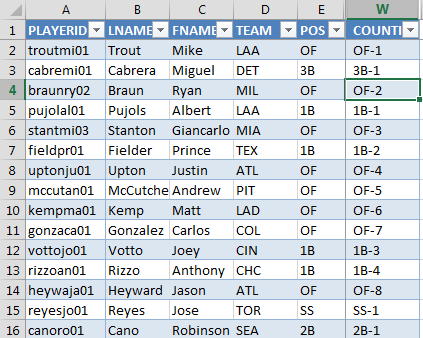
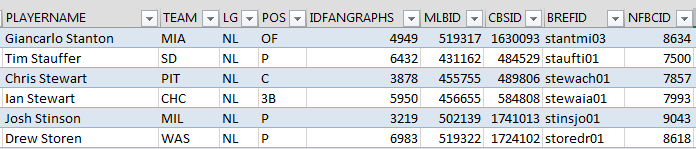
Why do you even use this ridiculous Player ID map?  There’s so much useless information on that thing.

Have You Ever Wondered These Things?

I have to say that I haven’t had anyone ask these questions, but I feel the need to address the questions nonetheless.  I don’t mean for them to be overly complicated, but there’s a good chance that the spreadsheets I design can be overwhelming.  So let’s take a closer look at the reasoning behind things.

There Is More Than One Way To Skin a Cat

I don’t think it’s much of a stretch to say that spreadsheet design is a form or art.  There are many different ways to get to the same end goal.  I’m always looking for new ideas and methods to add to my Excel work, and I’m certain there are more efficient and better ways to design things I have done.

With that said, I believe the principles I’m about to talk about are universal.  Whether you like the way I’ve designed things or if you prefer to do things a different way, using these concepts should help you out in the long run.

Why Do Your Spreadsheets Have So Many Tabs?

There are two main reasons for this:

  1. I want all of my spreadsheets to be reusable.
  2. I try to set things up so you only have to enter a piece of information one time.

Reusable Spreadsheets

We’ll take a close look at reusable design in a moment, but think about the different tabs/worksheets I use.  Raw projections, player information, replacement level information, and calculations all on separate worksheets.

By setting these up on distinct areas of a spreadsheet it allows you to easily update one of those components without screwing up the whole model.  Have new projection info?  Just replace the data on the projection tab.  Have a new Player ID Map?  Just copy it over top of the existing one.

This setup makes it much easier for your work to be updated during the season and into future seasons.

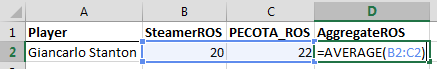
Entering Information Only Once

Dollar_Value_Inputs
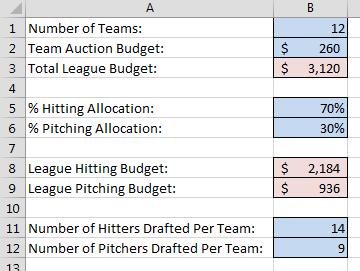
If you’ve read my book on calculating dollar values and in-draft inflation, you’ll recall that we added a “Settings” tab to the rankings spreadsheet.  On that tab we color-coded blue cells to indicate input cells.

These are just basic settings about the league, but by separating them out onto the “Settings” tab you only have to type the information one time.  If we didn’t do this, we would have to embed this information into our calculations for both the hitting and pitching rankings.

Everything is also formula-driven, so if a 13th team is added next year, or if team salary caps increase, or if you want to try a 65% hitting allocation, you can easily change those inputs and all calculations for hitters and pitchers update automatically.

If we didn’t have things set up this way you would have to search deep inside complex formulas on the hitter tab and edit these inputs.  And then you’d have to go do the same thing on the pitcher rankings.

And if you’re in more than one league you can set your rankings up for one league, just change the few settings different between the leagues, and you’ll easily have rankings tailored to each league you play in.

Why Don’t You Just Build Your Calculations Right on the Projections Tab?

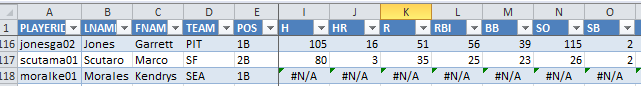
Whether you’ve downloaded projections from another website or you’ve created your own, it might seem like I’m over-complicating things by having the projections on one tab and then using formulas to pull the projections to a whole other worksheet where I then calculate rankings, SGP, and dollar values.

If I were to use this spreadsheet one time, I would agree with this line of thinking.  But take a look at this image.

Rankings_Spreadsheet_Design
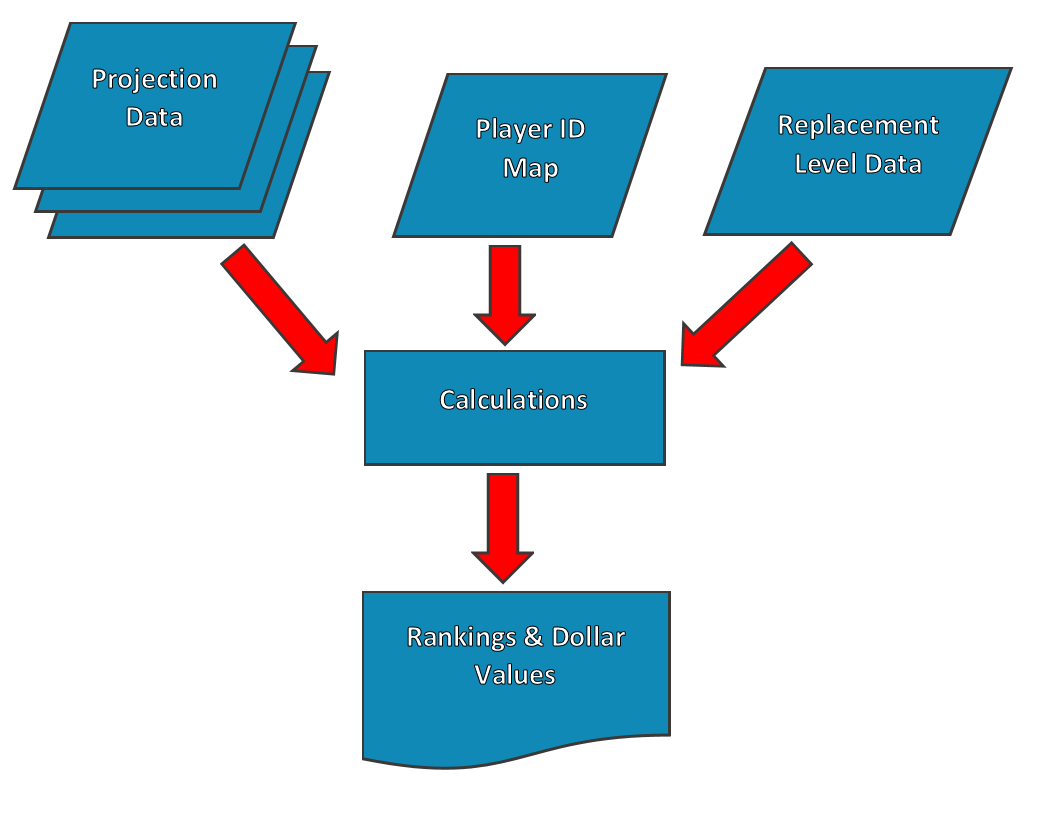
This is a very primitive flow-charting model of a rankings spreadsheet.  You have a few sets of raw data as inputs (the blue rhombuses, or is it rhombi?) – the projections, the Player ID Map, and replacement level data. Continue reading “Designing Reusable Fantasy Baseball Spreadsheets”

How To Pull a Player ID From a Hyperlink in Excel

Maybe you’re trying to build a the next great daily fantasy baseball spreadsheet.  Or maybe you’re attempting to figure out who to start next week.

You’ve got plans to use a powerful projection tool like Razzball’s Hitter-Tron…  but then you see it.  There’s not a player ID to be found!  How can you take data from a site like Razzball and drop it into your existing rankings, dollar value, or trade evaluator spreadsheets?

Giancarlo_Stanton_Ben_Zobrist_Daily_Projection

You Know Me.  I’m Obsessed With PLayer IDs.

They’re the best way to build a reusable spreadsheet that you can just drop projection data in to.  You can have all sorts of valuation formulas, trade evaluators, or daily roster lineup tools ready to go.  You just drop in some projections with player IDs and everything seamlessly links up and calculates.

Look Closely At the Links

Even if you don’t see a player ID at first glance, on many sites you can still get what you need if you look carefully.

Hover over a player’s hyperlink.  Depending on your browser you should somewhere see the web address for the hyperlink (in Google Chrome the destination of the link shows in the bottom left on the status bar).

Evan_Longoria_Razzball

There’s a player ID in there!  9368 for Evan Longoria.  A quick look at the PlayerID Map tells us the 9368 happens to be Evan Longoria’s Fangraphs ID.

Unfortunately, if you paste the Hitter-Tron information into Excel, you don’t get text about the web address.  You’re left with just the hyperlink itself and no reference to player ID #9368.

Zobrist_Longoria_Cruz_Beltre
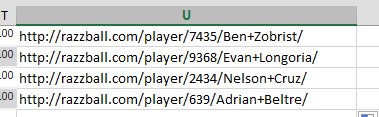
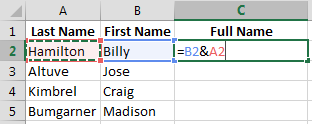
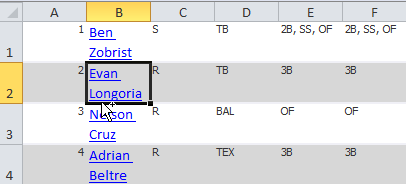
There’s not even an existing Excel formula we can use to just pull out the web address.  We have to get a little advanced and create our own.

Step-By-Step Instructions

Continue reading “How To Pull a Player ID From a Hyperlink in Excel”

The Difficulty In Aggregating Projections

Now that we’ve established that we can benefit from combining multiple projection models into one, let’s take a look at the challenges this presents.

I’ll also give brief explanations of how you can work around these challenges in Excel.  At the end I’ll discuss an Excel template I’m working on that will do these calculations for you automatically and how you can get your hands on it.

I love Your Feedback

If you’re a SFBB Insider you might recall that after you sign up, the very first e-mail I send you asks you to reply with any fantasy baseball topics you’d like to know more about or difficulties you’re having (if you’re not, you can register here.  I like to think it’s worth your while).

Insider

I Read All Of Those Responses

I’ve been fortunate enough to have nearly 500 people register, and I read every single response that comes in from that question.  One of the most frequent areas of interest is how to average, or aggregate, multiple sets of projections into one usable set of information.

More Difficult Than I Originally Thought

These requests started to roll in during the off-season, and I even replied to several people saying that I thought this was going to be easy and that I’d have guidance coming out soon on how to do this.

… And here I sit months later having never written on the topic yet.

In theory, averaging a set of three numbers in Excel is easy.  If one system says 25 HR, one says 30 HR, and another says 35 HR, Excel’s AVERAGE formula can easily respond with the average of 30.

But I quickly ran into some big problems that greatly complicated things.

Problem 1 – Lining Projections Up To Do The Averages

In order to aggregate multiple projection systems into one, we need a method of “lining up” the projections from one system with those of another system.  Perhaps Giancarlo Stanton is projected to hit 20 HR the rest of the season by Steamer and 22 HR by PECOTA.

Giancarlo_Stanton_ROS
I made this information up just to illustrate the concept of “lining up” different projections.

We can use formulas in Excel (e.g. VLOOKUP) to pull Stanton’s Steamer projection and place it next to his PECOTA projection.  But you can run into some complications in doing this.  What if one projection system lists him as “Stanton, Giancarlo” and the other as “Giancarlo Stanton”.

Using names to pull data also opens you up to inconsistencies in the name being used.  Is it Jonathan Singleton or Jon Singleton?  AJ Burnett or A.J. Burnett?

If you have taken on the challenge of creating your own rankings, you know that we’ve dealt with this problem before, but on a smaller scale.  In my rankings spreadsheets I use a consistent playerID to pull information between the different tabs.  I prefer to use the Baseball-Reference playerIDs because you can tell who a player is (Stanton is “stantmi03” because there were two other Mike Stanton’s before him).

But seemingly every major baseball site has their own player ID system.  Fangraphs says Stanton is “4949”, Baseball Prospectus uses “57556”, ESPN says “30583”, etc.

This is why I maintain the SFBB player ID map Excel file.  The map allows for this translation or “lining up” to happen.  It’s the bridge that can easily help you take Stanton’s projection from one system and place it next to his projection from another.  Giancarlo_Stanton_PlayerID

Problem 2 – Players Not Projected In All Systems

Continue reading “The Difficulty In Aggregating Projections”

How To Evaluate a Trade Using Standings Gain Points

In this video I’ll show you how to add a Trade Evaluator into your existing rankings spreadsheet.

Here’s an animated image demonstrating the finished product.  This spreadsheet will pull in all the Rest of Season projections for a player, their total SGP to be earned the rest of the season, and the player’s dollar value (provided you’ve added dollar value calculations to your sheets).

TradeEvaluator

I’ll also show you a practical example and explain a few important things to think about when considering trade offers.

The video is roughly 30 minutes long, but keep in mind that just about everything you create by following the guides on this site are long-term in nature.  With a little bit of maintenance, all of these tools can be used all season long AND into future seasons.

The Step-By-Step Process

I start with a spreadsheet that has already been updated with RoS Projections.  I then show you how to add a tab just to evaluate trades and other roster decisions.  We’ll add drop down menus that pull each player’s statistics, dollar value, and SGPs.

This information will enable you to add clarity to all your roster moves.  No more using your gut to analyze a 2-for-3 player trade involving hitters and pitchers.  You’ll be able to see exactly which side of the offer is better.

If you’re new to the site, I would suggest getting familiar with How To Create Your Rankings Using Standings Gain Points.

A Quick Suggestion

WatchVideoDoubleSpeed
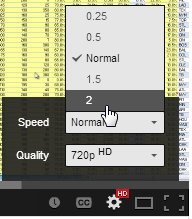
If you’re looking for a way speed things up by watching them 1.5 or 2 (double)  speed, cutting down the time it takes to watch significantly.  Just adjust the settings at the bottom of the video player.  Click the cog and change the “Speed to 1.5 or 2.

I also recommend watching the videos in HD.  A lot of the detail in Excel can only be seen well in 720p or higher.

And a Disclaimer

I created this video using Prince Fielder, Jose Abreu, Billy Hamilton, and Ian Kinsler in an example trade.  News that Fielder is facing season-ending surgery came out the next day!  I apologize for this glaring problem with the example, but hope you can still see the power of using a tool like this to evaluate trades and free agency acquisitions.

Here’s The Video

Thanks for Watching

Stay smart.

Questions?  Comments?  Future Video Ideas?

Let me know in the comments below.

How To Use SGP To Rank and Value Players During the Season – Part 6 – Adjust Replacement Level

Welcome to the final part of the series in which we go through the process of plugging Steamer’s Rest of Season (RoS) projections into your existing ranking/dollar value spreadsheet so you can make informed and objective roster decisions during the season.

If you register as an SFBB Insider (it’s free), you can receive the entire series in an easy-to-use e-book (also free) along with two other helpful guides.  I’ve also written a comprehensive guide on ranking players and calculating player dollar values that’s available at Amazon.

Introduction

In this sixth part of the series we will revisit the concept of replacement level and adjust replacement level for our updated RoS projections.

Reminders About Replacement Level

If you’re new to the concept of replacement level read the introduction here (don’t go into the “Step-by-Step Instructions”.  When you consider the injuries that occur in Major League Baseball, rookies being called up, players underperforming projections, and others exceeding projections, the player pool is constantly changing.

In order to make the best possible decisions and to calculate representative dollar values, it is very important that we update the estimate of replacement level.

Caution:  No Further Adjustments Necessary

When listening or reading fantasy advice, you might come across a piece of advice that goes something like this, “You really need to draft a SS early to account for the lack of depth at the position.  Go ahead and reach for that shortstop.”

Don’t listen to that advice when you’re using the approach we’re now going through.  The replacement level adjustment that follows is already calculating the effect of depth at each position.  And it does it mathematically.  There is no guesswork going on here.

DON’T MAKE ANOTHER ADJUSTMENT.

You do not need to make an arbitrary adjustment to shortstops or catchers, or any other position.  When you have added this adjustment to your rankings, each player will be ranked according the their value over the worst players at the position.  If the position is weak, that’s accounted for.  If the position is deep, it’s accounted for.

If you then decide to make arbitrary adjustments to your rankings after adding in the replacement level calculation, YOU ARE DOUBLE COUNTING.

You will be reaching for players and you will be hurting your team.  Don’t “bump” players up a list because of their position.

Step-By-Step Instructions

Continue reading “How To Use SGP To Rank and Value Players During the Season – Part 6 – Adjust Replacement Level”

How To Use SGP To Rank and Value Players During the Season – Part 5 – Update the Player ID Map

Welcome to the fifth part in a series of posts in which I’ll go through the process of plugging Steamer’s Rest of Season (RoS) projections into your existing ranking/dollar value spreadsheet so you can make informed and objective roster decisions during the season.

If you register as an SFBB Insider (it’s free), you can receive the entire series in an easy-to-use e-book (also free) along with two other helpful guides. I’ve also written a comprehensive guide on ranking players and calculating player dollar values that’s available at Amazon.

Introduction

In this fifth part of the series we discuss updating the Player ID Map to pull new players into the rankings information.

Player ID Map

The SFBB Player ID Map contains the Fangraphs, MLB, Baseball-Reference, Retrosheet, CBS, NFBC, ESPN, Baseball Prospectus, Davenport, and Yahoo player IDs for over 1,200 players.  It’s not a comprehensive list of past players by any means, but I make a concerted effort to have all current fantasy-relevant MLB players and those minor league players likely to make a fantasy impact this season.

PlayerIDMap

To give credit where credit is due, I originally downloaded the player map from Crunchtimebaseball.com and tailored it to meet my needs.  CrunchTimeBaseball is run by Tim Blaker.  He continues to maintain his own map of player IDs and generally keeps his more up-to-date than I do.  You can obtain his version here.

Why Update the Player ID Map

April inevitably brings us players that were never intended to be fantasy relevant; minor leaguers that were not anticipated to make the jump, role players thrust into starting jobs, and more.  As the summer rolls on, impact rookies begin to get called up that may not have been in the preseason Player ID Map.  When September arrives there will be more of the same.

While it is possible to add individual players to the player ID map, it can be inefficient to add more than a handful.  Updating the entire list is probably easier.

Step-By-Step Instructions

Continue reading “How To Use SGP To Rank and Value Players During the Season – Part 5 – Update the Player ID Map”

How To Use SGP To Rank and Value Players During the Season – Part 4 – Add the IFERROR Formula

Welcome to the fourth part in a series of posts in which I’ll go through the process of plugging Steamer’s Rest of Season (RoS) projections into your existing ranking/dollar value spreadsheet so you can make informed and objective roster decisions during the season.

If you register as an SFBB Insider (it’s free), you can receive the entire series in an easy-to-use e-book (also free) along with two other helpful guides. I’ve also written a comprehensive guide on ranking players and calculating player dollar values that’s available at Amazon.

Introduction

In the fourth part of the series we’ll introduce a new Excel formula to help remove lookup errors, like those shown above, from our spreadsheets.  These occur when we have instructed Excel to do a VLOOKUP to find a player’s RoS projections and Excel is unable to find the player ID within the projection data.

Often times a player will stop appearing in the RoS projections.  This might be because they’ve suffered a season-ending injury, they’ve retired, or they’re an unsigned free agent. If that player remains in the list of hitters or pitchers rankings, no projection can be found for that player.  I’ve realized that the rankings and dollar value formulas I previously used did not handle these situations very well, so it’s necessary to adjust these formulas slightly.

Adding this formula to your spreadsheet is a one-time fix.  You won’t need to go through this part when you download updated RoS projections in the future.

Excel Functions in Part 4

IFERROR

The IFFERROR function allows us to control what happens when another function being used is calculating an error.  The image below is a great example of this.  On our “Hitter Ranks” tab we have a series of VLOOKUP formulas that instruct excel to go find Kendrys Morales’ player ID (moralke01) in the “Steamer Projections” tab.  During the 2014 season Morales is likely not included in the RoS projections because he remains unsigned by any Major League team.

IFERROR-Excel-Formula

The IFFERROR function will allow us to replace the error message with any value of our choice.  It essentially works by telling Excel, “If this other formula I’m using comes back with an error, use this instead”.

The formula requires two inputs:

IFERROR(value,value_if_error)

  1. Value – This represents the formula or calculation we want Excel to perform.  In our example above it will be the same VLOOKUP formula we already have entered.
  2. Value_if_error – This represents the value or message we want Excel to return if the first argument, “Value”, returns an error.  In our example above we don’t want the default “#N/A” error message that turns up if Excel cannot locate Kendrys Morales in the RoS projections.  Instead, we could just ask for Excel to return zeroes for his projected stats.

Step-By-Step Instructions

Continue reading “How To Use SGP To Rank and Value Players During the Season – Part 4 – Add the IFERROR Formula”

How To Use SGP To Rank and Value Players During the Season – Part 3 – Delete Old Info and Insert New RoS Projections

Welcome to the third part in a series of posts in which I’ll go through the process of plugging Steamer’s Rest of Season (RoS) projections into your existing ranking/dollar value spreadsheet so you can make informed and objective roster decisions during the season.

If you register as an SFBB Insider (it’s free), you can receive the entire series in an easy-to-use e-book (also free) along with two other helpful guides. I’ve also written a comprehensive guide on ranking players and calculating player dollar values that’s available at Amazon.

Introduction

In this third part of the series we will remove the old (preseason) projections from our spreadsheet and paste in the new information.  It sounds simple, but there are a few tricks to be aware of.

Step-By-Step Instructions

Continue reading “How To Use SGP To Rank and Value Players During the Season – Part 3 – Delete Old Info and Insert New RoS Projections”

How To Use SGP To Rank and Value Players During the Season – Part 2 – Download and Prepare Rest of Season Projections

Welcome to the second part in a series of posts in which I’ll go through the process of plugging Steamer’s Rest of Season (RoS) projections into your existing ranking/dollar value spreadsheet so you can make informed and objective roster decisions during the season.

If you register as an SFBB Insider (it’s free), you can receive the entire series in an easy-to-use e-book (also free) along with two other helpful guides. I’ve also written a comprehensive guide on ranking players and calculating player dollar values that’s available at Amazon.

Introduction

In the second part of the series we will download the free Rest of Season Steamer projections that are available from Fangraphs.com.

Step-by-Step Instructions

Step Description
1. Visit Fangraphs’ Steamer RoS projections at this link or visit Fangraphs.com and hover over the “Projections” link on the menu bar and look for “Steamer (RoS)”.Fangraphs2
2. Once the page loads, use the link to “Export Data”.Fangraphs-RoS-Export
3. The data will download in CSV (comma separated value) format. Locate the downloaded CSV file and open it.

It should open in Microsoft Excel (if it doesn’t, launch Excel and then use the File>Open menu to open the CSV file).

You might recall from our earlier work that theFangraphs reports come withPlayerID as the last column in the file. We must move thisto be the first column so we can later use the VLOOKUP formula to pull data from theseRoS projections.Once the file opens, locate the “playerid” column. Right-click on the column header (column “W” in the image below) and choose to Cut the column.Cut_Fangraphs_ID

4. Now right-click on the first column header and choose the option to “Insert Cut Cells”.Insert_Fangraphs_ID
5. Repeat the steps above for pitchers. You can obtain RoS Steamer pitcher projections here or by clicking the “Pitchers” button at the top of the Steamer hitters web page.Steamer_RoS_Pitchers

The “playerID” column is currently column “S” in the Steamer RoS download.Excel-ROS-Projection-Part2-6

6. You have finished reordering the information and have copied it so it can be pasted into your rankings and dollar value calculation spreadsheet.

Example Excel File

We did not edit the main dollar value calculation spreadsheet in this part, so no example spreadsheet is provided.

Questions?

Do you have questions about Part 2? Or want to see what others have asked? Comment below.