How To Use SGP To Rank and Value Players During the Season – Part 3 – Delete Old Info and Insert New RoS Projections

Welcome to the third part in a series of posts in which I’ll go through the process of plugging Steamer’s Rest of Season (RoS) projections into your existing ranking/dollar value spreadsheet so you can make informed and objective roster decisions during the season.

If you register as an SFBB Insider (it’s free), you can receive the entire series in an easy-to-use e-book (also free) along with two other helpful guides. I’ve also written a comprehensive guide on ranking players and calculating player dollar values that’s available at Amazon.

Introduction

In this third part of the series we will remove the old (preseason) projections from our spreadsheet and paste in the new information.  It sounds simple, but there are a few tricks to be aware of.

Step-By-Step Instructions

Continue reading “How To Use SGP To Rank and Value Players During the Season – Part 3 – Delete Old Info and Insert New RoS Projections”

How To Use SGP To Rank and Value Players During the Season – Part 2 – Download and Prepare Rest of Season Projections

Welcome to the second part in a series of posts in which I’ll go through the process of plugging Steamer’s Rest of Season (RoS) projections into your existing ranking/dollar value spreadsheet so you can make informed and objective roster decisions during the season.

If you register as an SFBB Insider (it’s free), you can receive the entire series in an easy-to-use e-book (also free) along with two other helpful guides. I’ve also written a comprehensive guide on ranking players and calculating player dollar values that’s available at Amazon.

Introduction

In the second part of the series we will download the free Rest of Season Steamer projections that are available from Fangraphs.com.

Step-by-Step Instructions

Step Description
1. Visit Fangraphs’ Steamer RoS projections at this link or visit Fangraphs.com and hover over the “Projections” link on the menu bar and look for “Steamer (RoS)”.Fangraphs2
2. Once the page loads, use the link to “Export Data”.Fangraphs-RoS-Export
3. The data will download in CSV (comma separated value) format. Locate the downloaded CSV file and open it.

It should open in Microsoft Excel (if it doesn’t, launch Excel and then use the File>Open menu to open the CSV file).

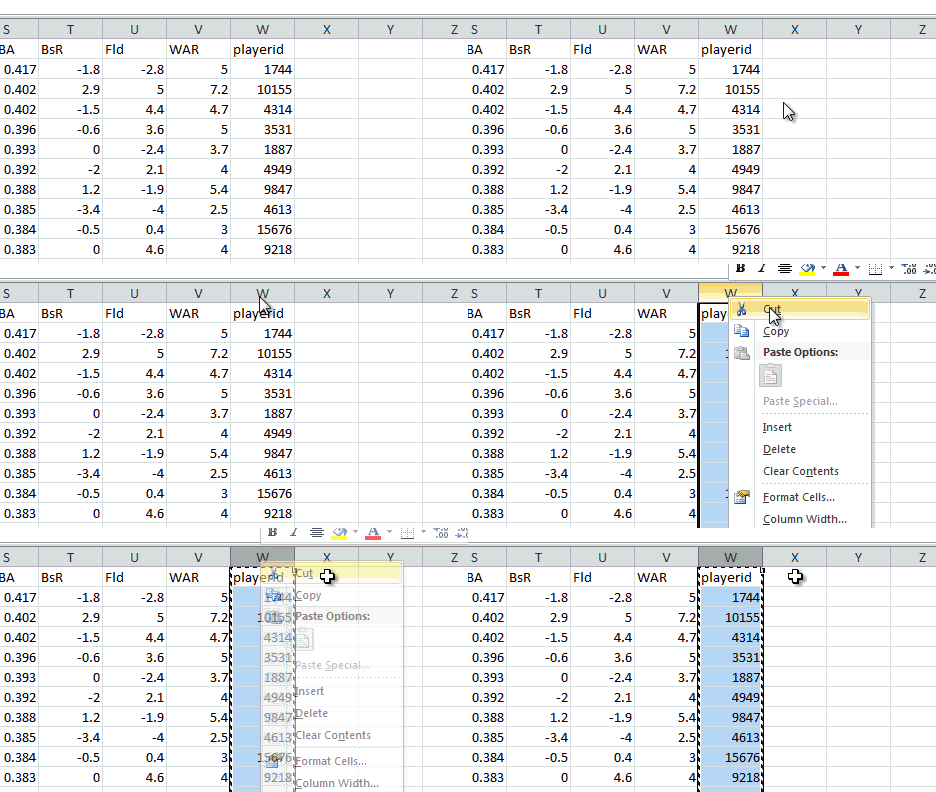
You might recall from our earlier work that theFangraphs reports come withPlayerID as the last column in the file. We must move thisto be the first column so we can later use the VLOOKUP formula to pull data from theseRoS projections.Once the file opens, locate the “playerid” column. Right-click on the column header (column “W” in the image below) and choose to Cut the column.Cut_Fangraphs_ID

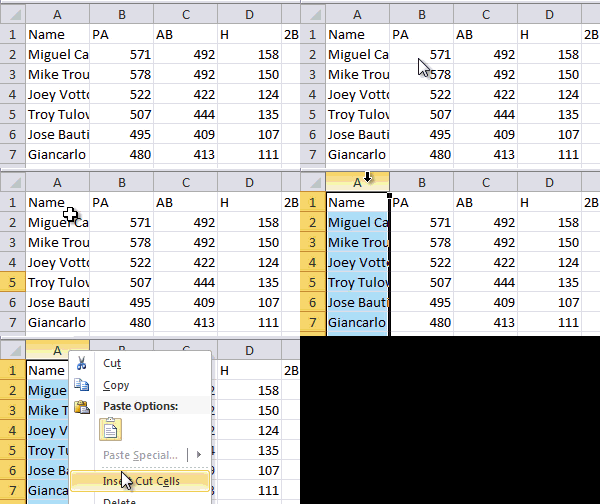
4. Now right-click on the first column header and choose the option to “Insert Cut Cells”.Insert_Fangraphs_ID
5. Repeat the steps above for pitchers. You can obtain RoS Steamer pitcher projections here or by clicking the “Pitchers” button at the top of the Steamer hitters web page.Steamer_RoS_Pitchers

The “playerID” column is currently column “S” in the Steamer RoS download.Excel-ROS-Projection-Part2-6

6. You have finished reordering the information and have copied it so it can be pasted into your rankings and dollar value calculation spreadsheet.

Example Excel File

We did not edit the main dollar value calculation spreadsheet in this part, so no example spreadsheet is provided.

Questions?

Do you have questions about Part 2? Or want to see what others have asked? Comment below.

How To Use SGP To Rank and Value Players During the Season – Part 1 – Introduction to Rest of Season Projections

Welcome to the first part in a series of posts in which I’ll go through the process of plugging Steamer’s Rest of Season (RoS) projections into your existing ranking/dollar value spreadsheet so you can make informed and objective roster decisions during the season.

A few notes about the series:

Let’s Get Started

If you’re a frequent reader of this site, hopefully you spent the offseason toiling over a spreadsheet making projections, developing rankings, and calculating dollar values.

That dynamite spreadsheet you created has probably been sitting on the shelf for the last month accumulating dust.  But did you know you can still use it to make informed in-season roster decisions?

I’ll show you how in a second.

Avoid This Scenario

Once the season starts, we immediately become retrospective in our decision making. You navigate out to the free agent listing and you see the stats players have accumulated to date.  Some utility infielder with a .240 career average is sitting there staring at you with 5 HR and a .386 batting average to start the season.

This is bad.  We don’t draft based on last season’s stats, so why should we make current roster decisions about last week’s stats?

As we do during the draft, we should be making roster decisions based on projected or future performances.

Some sites do offer full season projections.  They are helpful, but they become less meaningful as the season progresses.  Full season projections are likely not being updated, and we don’t care about the stats that someone has already earned.

What we really want are rest of season projections.  Or what a player is going to do from here on out.

How To Obtain Rest Of Season (RoS) Projections

Continue reading “How To Use SGP To Rank and Value Players During the Season – Part 1 – Introduction to Rest of Season Projections”

In Season Player ID Map Update

I’m preparing to roll out another resource that will hopefully help bring clarity to your in-season moves (I think it’s going to be big!).  In preparation for this, I’ve gone through and done a Player ID Map update to include players that have recently become “fantasy-relevant”, in my mind.

You can download the updated map here.

A complete list of changes can be found in the “Change Log” tab of the spreadsheet.

ESPN_Player_ID

Some of the more notable additions to are:

If you’re new to the site, consider checking out these past posts that illustrate some interesting things you can do with player IDs.

Please let me know if I’ve missed anyone.  Stay smart.

Cautionary Notes About Sample Size Stabilization Points

In this post I’m going to try to tie a pizza utensil, Bill Murray, and Charlie Blackmon together all while trying to help you avoid a pitfall I think many are making in their fantasy baseball research.

Read enough fantasy baseball advice and you’re bound to come across something like this:

We can now trust player x’s <insert rate statistic here> because he’s reached the number of plate appearances for the stat to become reliable.

Or maybe this:

We’ve reached the point of the season where <insert rate statistic here> starts to stabilize.

Maybe you even clicked on a link near the comment, saw some fancy tables with a lot of other stats and when they “stabilize”, references to r-squared, and then concluded, “Seems legit to me.”

These comments are usually followed by some kind of analysis that uses the stat in order to project into the future.  This is the problem!  More on that in a bit.

Not So Fast My Friend

I’ve long been a victim of this.  I’m not a statistician, so if I someone makes claims like this and links to a study that looks legitimate at a quick glance, I’ll buy into it.  This seemed even more reliable because the study is quoted at a lot of reputable sites like Fangraphs, Beyond the Box Score, and more.

But I’m also a regular listener of Fangraphs’ “Sleeper and the Bust Podcast” with Eno Sarris and Jason Collette. I’ve heard Sarris mention a disclaimer several times when referring to sample size stabilization points that has always left me a little unsettled. So I decided to investigate.

A Little History

The original study was performed in 2007 by a man writing under the name “Pizza Cutter”.  It’s a heavy load of information to consume, but I do recommend it so you can understand how he performed the test.  Plus, it’s proven to be a very popular piece of reference material, so it wouldn’t hurt to familiarize yourself with it.

You can’t really tell from the original study, but it turns out that the research has been misused and misinterpreted by many people.  So much so that Pizza Cutter himself has since written several times that his work is being misused.

These Stats Are Not Predictive

Russel A. Carleton, who ditched the Pizza Cutter nickname (except on Twitter), is the man behind the stabilization points research.  He has this to say about the predictive value of stabilization points:

…they are not nearly as powerful in predicting the future as people seem to believe that they are.

And it makes sense.  When developing projections before the season starts, the typical projection system uses at least three years of data.  So then why are we so quick to believe that three weeks of April at bats are meaningful at predicting the rest of the season!?!?!

When referring to an example of how his study is used to say, “this new strikeout rate that we’ve seen is what we can start to expect”, Carleton writes,

That’s not what the study was actually about.

If you haven’t gone and read the article yet, I do recommend it.  You can just sense the angst in Carleton’s writing.  The title of the article, “It Happens Every May”, speaks volumes.  I can just see Carleton surfing the web as we speak reading countless articles inappropriately referencing his work and thinking to himself, “Every season I have to put up with this $#!_”.

It Helps To Understand What Carleton Was Trying To Do

Carleton wasn’t trying to develop a projection methodology in doing this research.  He states that one of his favorite things to do is to make up his own statistics and study if they correlate to other metrics we already use in baseball research.

It doesn’t make sense to do advanced baseball research on small sample sizes.  So all he wanted to know was how soon into a season, or with how small of a sample size, could he begin conducting these studies of his.

What Stabilization Points Really Mean

Continue reading “Cautionary Notes About Sample Size Stabilization Points”

New Tool – Historical Batting Lineups By MLB Team

Where a player hits in the lineup matters.  For every spot a player moves down the order (lead off to second, fifth to sixth, etc.), that player loses approximately 0.1 plate appearances per game, or about 16 plate appearances over the course of the season.

If a player moves from second to third…  not a big change in a player’s value.  But if you were originally projecting a player to bat 9th and he gets bumped up to be the lead off hitter, that could increase a player’s value 15-20% (8 lineup spots * 16 plate appearances = 128 additional PAs)!!!

I Stumbled Upon This Very Helpful Page at BaseBall-Reference.Com

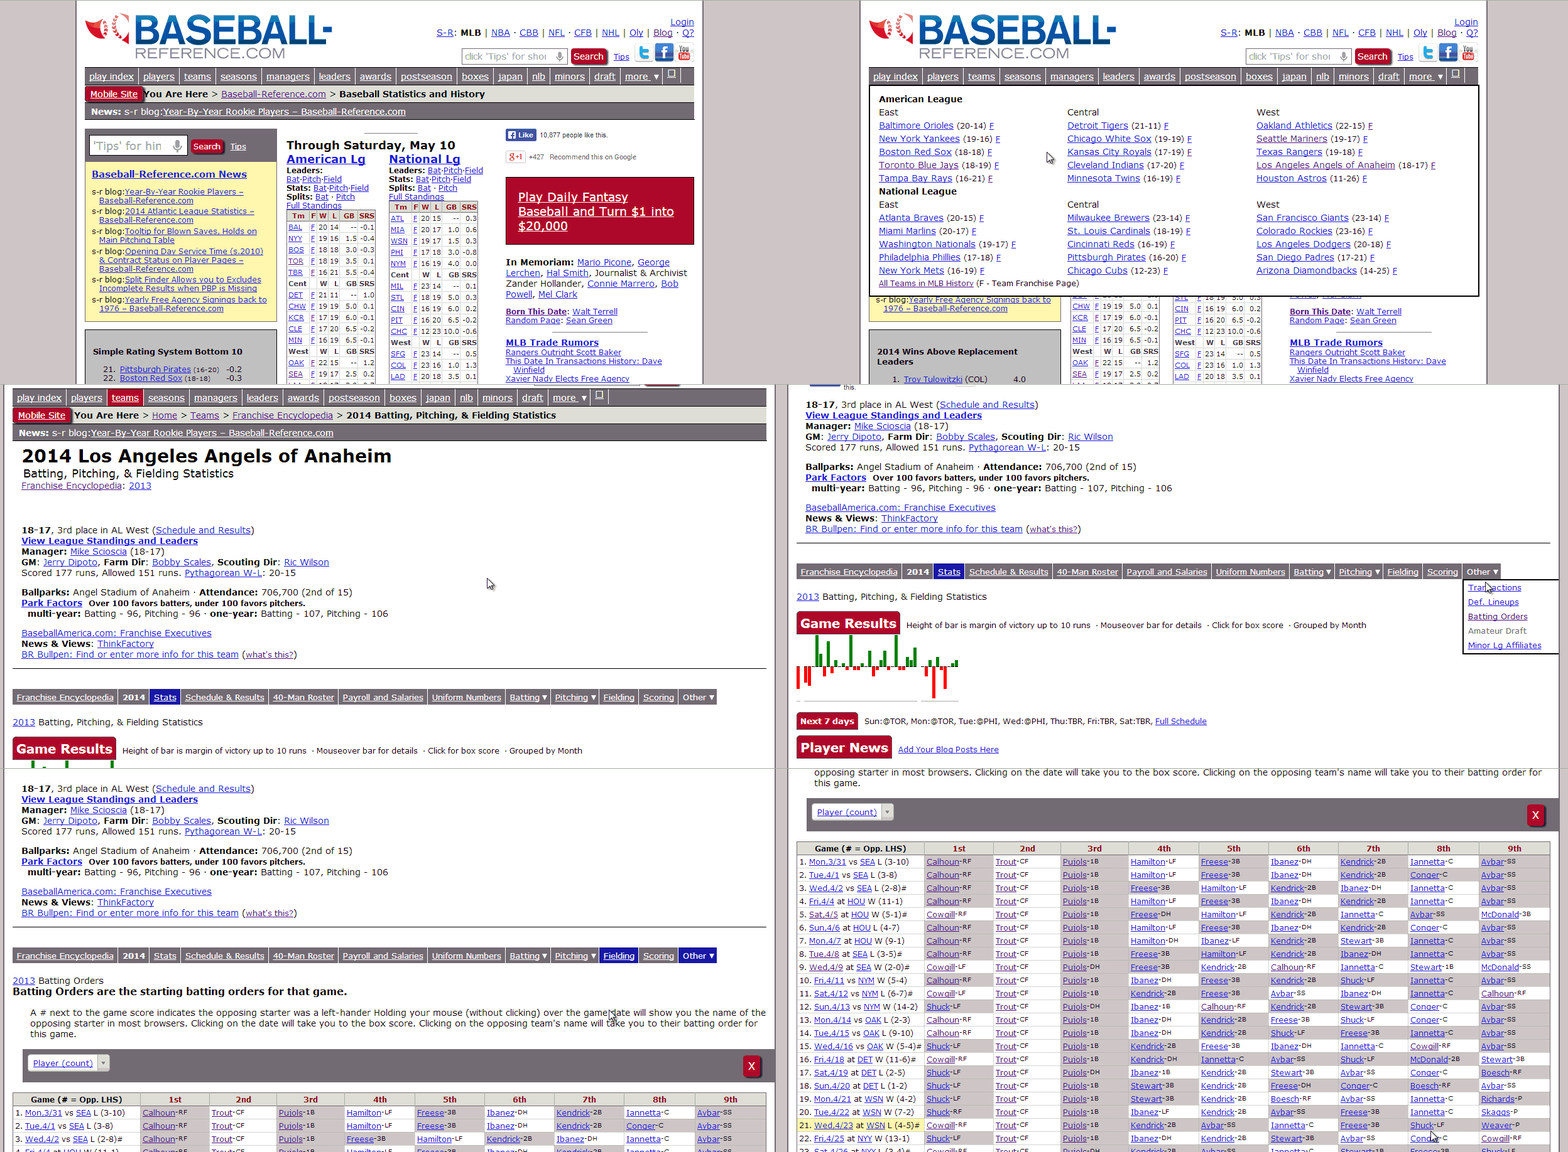
Each team at baseball-reference.com has a batting order page that displays the starting lineup for each game.  Baseball_Reference_Batting_Order

This is a great way to keep an eye on trends in a team’s lineups and to monitor where your players are hitting.  I’ll often try to check this and it usually takes several clicks to drill down into a player’s game log, click on the last few games, scroll down to the box scores, click back a few times to check the next game, etc.

But these team pages will make it much easier to get the information.

baseball-reference-batting-orderA Lot Of Useful Information

Continue reading “New Tool – Historical Batting Lineups By MLB Team”

Improved SGP Calculation Formula – Part III

Welcome to the final of a three-part series in which we take a closer look at an improved method of determining standings gain points factors.  In the first part of the series we looked at the difference between my old method of calculating standings gain points factors and the improved approach suggested by Art McGee in his book, How to Value Players for Rotisserie Baseball.  In the second part of the series we looked at how to implement the SLOPE function in Microsoft Excel.

In this final part of the series we take a closer look at how these SGP changes affect the end rankings.

Old Vs. New

As I alluded to in part two, I’ve been tracking the standings history (link to view Excel file) for my favorite league for several years and I use this history to calculate my SGP factors.  Here’s a summary of the factors calculated under my old approach stacked up against the factors as calculated by the SLOPE function suggested by Art McGee in How to Value Players for Rotisserie Baseball.

Stat Old Approach SLOPE Approach % Change
BA 0.00184 0.00169 -8.15%
HR 9.63059 8.87013 -7.90%
R 24.82973 22.02314 -11.30%
RBI 25.05772 22.30803 -10.97%
SB 10.00577 8.18620 -18.19%
ERA -0.10587 -0.08817 -16.72%
K 35.14141 31.6227 -10.01%
SV 6.41558 5.69641 -11.21%
W 3.34776 2.95793 -11.64%
WHIP -0.01788 -0.01518 -15.10%

Continue reading “Improved SGP Calculation Formula – Part III”

Improved SGP Calculation Formula – Part II

Welcome to Part II of a three-part series in which I’ll share an improved method of determining standings gain points factors.  In the first part of the series we looked at the difference between my old method of calculating standings gain points factors and the improved approach suggested by Art McGee in his book, How to Value Players for Rotisserie Baseball.  

In this part of the series I’ll explain how to implement the SLOPE function McGee suggests.

The SLOPE Function

The SLOPE function interprets a set of data points and returns the slope of the linear line-of-best-fit for the data. The function requires two inputs:

  1. The Y-values of all the data points
  2. The X-values of all the data points

Again, we’re back in high school math class (or earlier?).  The Y-values (vertical axis) will be the actual accumulated statistics for each team in the league for the category we’re measuring.

The X-values (horizontal axis) will be the rotisserie points earned for each team.

For example:

Rotisserie Points (x-values) Home Runs (y-values)
12 291
11 287
10 281
9 274
8 272
7 267
6 263
5 261
4 244
3 239
2 234
1 191

Let’s Put This Into Excel

You can see the data entered into Excel below.

Given this exact set of data, the formula used in Excel to calculate the slope is:

=SLOPE(B2:B13,A2:A13)

A More Comprehensive Example

This is only the home run data for one season for one league.  In order to calculate more accurate SGP factors we should be including multiple years and/or leagues and we also need to perform these calculations for many different statistics (not just home runs).

A more thorough example Excel file that contains several years of data and the SLOPE calculations for the different years can be found below.  It’s not my prettiest work, but this is a file you only need to be in once a year, when you’re updating your SGP calculations for an upcoming season.  You can download the file using the ExcelWebApp toolbar below the spreadsheet.

WHAT’S COMING?

In the final part of the series I’ll take a deep dive into how these changes in SGP calculations affect our end rankings.

Want More In-Depth Analysis Like This?


Thanks For Reading

Stay smart.


Improved SGP Calculation Formula – Part I

Welcome to Part I of a three-part series in which I’ll share an improved method of determining standings gain points factors.  In this first part I’ll show graphically demonstrate the old method I used in calculating SGP factors and compare it to the improved method.

I’m mostly self-taught when it comes to my knowledge of standings gain points.  It’s hard to say where I picked up the information.  I think it’s an accumulation of information gleaned from message boards and old web sites.  Nevertheless, I continue to learn and I recently came across an improved method of calculating SGP factors.

Enter Art McGee

Art McGee published his approach to using standings gain points in his book, How to Value Players for Rotisserie Baseball.  The book was originally published in 1997 and he put out an updated version in 2007.  So his theories have been around for quite some time and continue to live on.  The Excel implementation of SGPs that I use has been tweaked some, but is very consistent with McGee’s approach.

NOTE:  I have provided an affiliate link (what’s an affiliate link?) to the book on Amazon to the right, but at the time of writing, I don’t suggest you buy it from Amazon.  It seems like the book is difficult to come by and the prices are quite high.  The link is just so you can see the book and read the summary, or maybe the prices will come down in the future.  If you do want to purchase McGee’s book, Baseball HQ is selling them on a close out sale for $8.95 plus S&H.  That’s where I got my copy.

A Difference Is Found

Not too far into McGee’s explanation did I come across an important difference in the way he calculates his SGP factors.  To illustrate the difference, let’s take a look the following sets of Home Run standings:

Rotisserie Points HR Data Set #1 HR Data Set #2
12 291 300
11 287 273
10 281 260
9 274 249
8 272 249
7 267 248
6 263 243
5 261 241
4 244 231
3 239 231
2 234 229
1 191 203

I previously would have calculated my SGP factor for “HR Data Set #1” as the first place value (291) less the last place value (191), divided by the number of teams that could be passed (in a 12-team league you pass 11 teams by going from worst to first).  Specifically the SGP for Data Set #1 is 9.0909 ((291-191)/11) and for Data Set #2 is 8.8182 ((300-203)/11).

Let’s Plot It Out

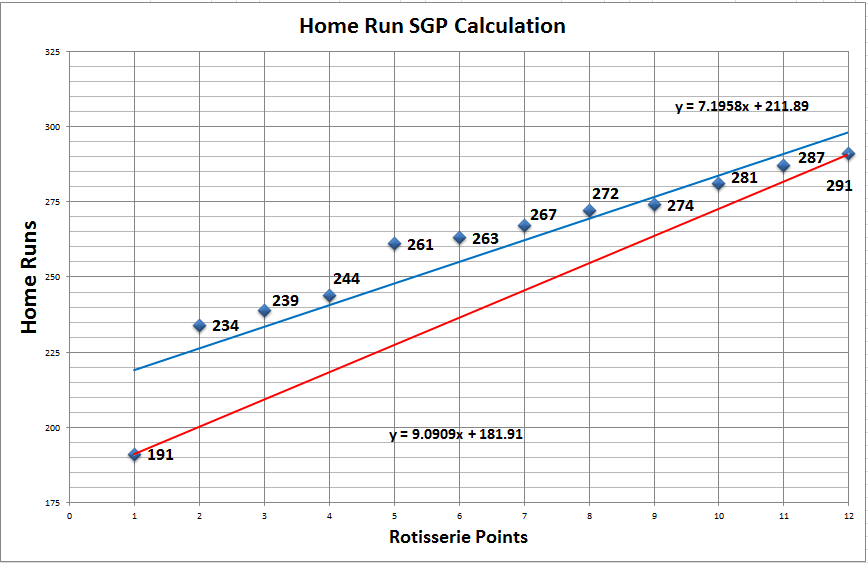
The red line below plots out the approach I have been using to calculate my SGP factors.  If you think back to high school math class, we’re really calculating the slope of the line here.  Notice how the 9.0909 I calculated above matches the slope in the formula representing the red line, y = 9.0909x + 181.91.

And when you look at the red line next to the other plotted data points, you see that it doesn’t do a great job of fitting data as a whole.  This is the weakness in only using the highest and lowest data points to approximate the number of home runs necessary to move up one point in the standings.

Home_Run_Standings_Gain_Points Continue reading “Improved SGP Calculation Formula – Part I”

2014 Player ID Map Update

Draft day has come and gone, but if you’re looking to keep up-to-date with the Player ID Map, I’ve run a significant number of changes through the file.  In addition to adding rookies that should have a fantasy impact this year, a number of edits to player teams were made, many missing IDs were filled in, and Davenport, Baseball Prospectus, and Yahoo IDs were added to the file.

You can download the updated map here.

A complete list of changes can be found in the “Change Log” tab of the spreadsheet.

ESPN_Player_ID

Some of the more notable additions to the Player ID Map are:

  • Masahiro Tanaka
  • Noah Syndergaard
  • Jameson Taillon
  • Archie Bradley
  • Alexander Guerrero
  • Miguel Sano
  • Maikel Franco

If you’re new to the site, consider checking out these past posts that illustrate some interesting things you can do with player IDs.

Please let me know if I’ve missed anyone.  Stay smart.