How Do I Calculate SGP For OPS?

We’ve now calculated SGP for three rate statistics:  batting average, on-base percentage, and slugging percentage.  So let’s go for the ultimate challenge and combine two ratio statistics together!

This is the most complicated calculation yet, because of the fact that we have two rate stats being combined together.  And to make matters more complicated, in this scenario, we don’t know the breakdown of OPS into OBP and SLG.  Despite that, I think we can calculate the SGP factors accurately.

Let’s take a look at how to perform an SGP calculation for on-base plus slugging (OPS).

A Warning About This Data

What follows is a step-by-step calculation for determining OPS SGP in an NL-only league.  I do not have standings data for a mixed-league using OPS as a category.

If you play in a mixed league, use these exact SGP factors at your own risk.  They’ll give you an approximation, but the OPS standings in a mixed league will surely be different than in an NL-only league.

The good news is that if you have standings history for your own OPS league, you can follow this exact methodology to calculate the SGP factors for your league.

The Standings Data

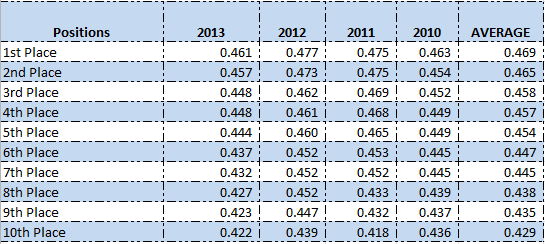
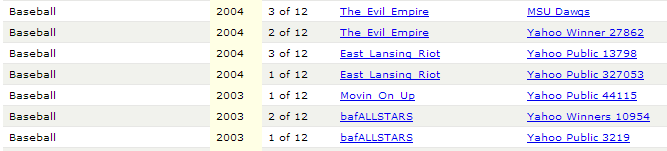
Thanks to reader Bob who filled out the “What It Takes To Win Your League Calculator” with six years of data from this NL-only league:

SGP_OPS_Standings

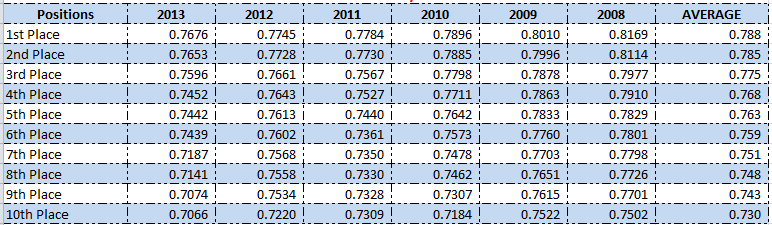
The decline in OPS over this time frame was eye-catching to me.  So much so, that I think we’d be doing ourselves a disservice to include all six years of data.  And the decline happens at all spots in the standings (1st place and 10th place).  It’s roughly a 40 to 60 point drop from 2008 to 2013 regardless of the position in the standings you look at.  The numbers from just 2011 to 2013 look much more consistent.

With this in mind, I decided to trim things down to only include the last three years of data.  This is worth keeping in mind for all statistical categories.  I’m sure HR are down in all formats too.  So including ten years of history in your HR calculations may not be appropriate.

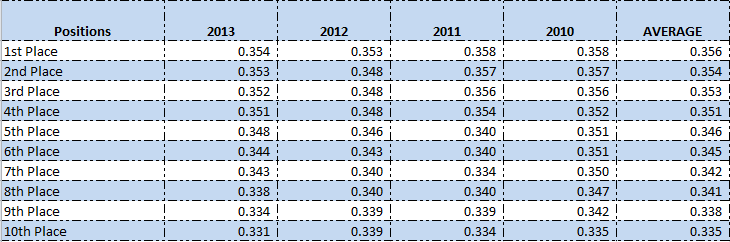
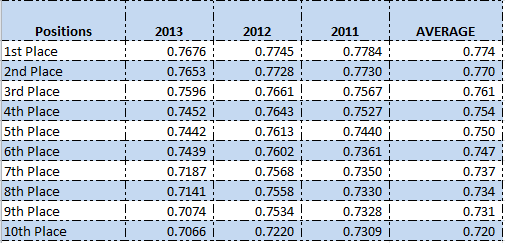
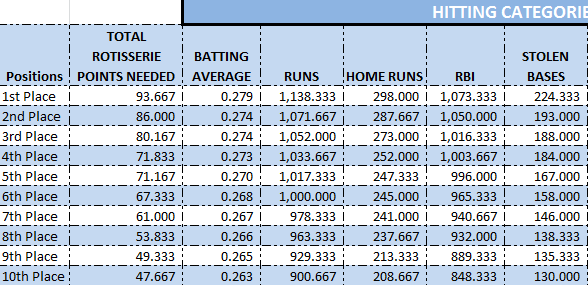
Here are only the last three years:

SGP_OPS_Standings2

How Many OPS Percentage Points Move You Up One Spot In The Standings?

Over the last three years, an average of .774 won the category and an average of .720 finished 10th.

.774 – .720 = .054 total spread between 10 teams

We have the data for 10 teams, meaning there are 9 spots you can move up in the standings by moving from .720 to .774 in team OPS.

.054 / 9 = .006

On average, increasing your team OPS by .006 points (in this NL-only league) will result in you climbing one spot in the standings.

What Formula Do I Use To Calculate The SGP For a Given Player?

Continue reading “How Do I Calculate SGP For OPS?”

Projecting X Bundle Update – 2014 Expected Runs Per Game Information

For those that have purchased the SFBB Projecting X Bundle (click here to read about the Bundle or here if you’re interested in purchasing), I have compiled expected runs per game metrics from around the web and put them into a format that you can drop into your Projecting X spreadsheet.

In Projecting X, Mike Podhorzer refers to Baseball Prospectus, Clay Davenport, and Replacement Level Yankees as the resources he uses for his expected RPG metric (this is an input into estimating pitcher wins).  I was able to locate the BP and Davenport information, but from what I can tell, Replacement Level Yankees has not published the projection.  If you can locate it, please feel free to link to it in the comments below this post.

Fangraphs also provides projected standings, and so I included them as the third input.

You can download this file below through the buttons at the bottom of the web part, or possibly even copy and paste from here into your own spreadsheet.

You’ll notice that I removed the 2013 information that was the best guess for 2014 runs per game at the time the bundle was created and released.

Thanks For Reading

Stay smart.

You Need To Read This If You Play In a Two-Catcher League

In this post I’m going to demonstrate why you can’t simply rely upon the rankings information you find online.  Widely available rankings do not account for the intricacies of your league.  These differences can lead to large swings in the valuations of players.

You should be calculating your own rankings specific to your own league format, especially if you play in a two-catcher league.  There is a valuation problem waiting to be exploited in two-catcher leagues.  

Please make sure you read to the end.  I get a little carried away with examples below, but there are some important conclusions at the end.

This Is Not a Lie

When I run Steamer’s 2014 projections through my ranking system, Buster Posey and Wilin Rosario come out as top 10 players.

Let that sink in.  In all the draft preparation and rankings articles you’ve read so far, have you seen any catcher crack the top ten?

You’re a Moron.  Your Ranking System Must Be Wrong.

Before you dismiss this out of hand, let’s work through a little exercise.  As with most scenarios I outline at this site, let’s assume a 12-team mixed league using standard 5×5 rotisserie categories, 14 hitters (2 C, 1B, 2B, SS, 3B, CI, MI, 5 OF, UTIL), 9 pitchers, and no bench. This would mean 24 catchers would be drafted, 60 OF, and 168 total hitters.

So as not to pick on any one analyst, I’ll be referring to the consensus fantasy baseball hitter rankings that FantasyPros.com puts out (if you don’t use this tool, it’s pretty neat.  You can instantly average the rankings of your favorite analysts).

As of March 10th, Buster Posey comes in as the top catcher and 36th ranked hitter.  Matt Holliday comes in as the 35th ranked hitter.

Matt_Holliday_Buster_Posey

Let’s say Team A drafts Holliday and with the very next pick, Team B drafts Posey.

If a ranking system were really accurate, you would think the combined stats from Holliday (the 35th ranked player) and Team A’s final draft pick should be very similar to the combined stats of Posey (the 36th ranked player) and Team B’s final draft pick.

Let’s Take a Look

Because Team A passed on Posey, let’s assume they decide to wait until the last round of the draft to fill their second catcher slot by taking the 24th ranked catcher.  In those same consensus rankings, the 24th catcher is Welington Castillo.

Wellington_Castillo

And because Team B wasn’t able to take Holliday with their pick, they decide to wait until the last round to draft their fifth outfielder.  When the time comes, Team B selects the 60th ranked OF (12 teams * five OF per team).  The consensus rankings tell us Kole Calhoun is that guy.

Kole_Calhoun

So Team A ends up with Holliday and Castillo.  Team B ends up with Posey and Calhoun. Applying Steamer’s 2014 projections to these two teams we get:

Player AB H AVG HR R RBI SB
Holliday 530 152 .287 22 78 81 4
Castillo 365 92 .252 12 41 45 2
Total Team A 895 244 .273 34 119 126 6
Player AB H AVG HR R RBI SB
Posey 557 165 .296 20 78 84 2
Calhoun 529 141 .267 17 72 69 11
Total Team B 1,086 306 .282 37 150 153 13

Wow.

Team B wins every category.  The reason for this is the concept of the replacement level players.  The 60th (last picked) OF is still pretty productive, whereas the last catcher selected is a problem.

Maybe Posey should be ranked higher if he gives you that big of an advantage.

You Cherry Picked This Example.  No Way Does This Work Out Like This Every Time.

It is very possible Calhoun is also slanting the results.  When I run his Steamer projection through my ranking system he comes out as the 41st OF (so the consensus rankings are underrating him by ranking him the 60th OF).  I think he’s a terrific sleeper.  So let’s drop twenty three more spots down to Gerardo Parra.

Why Parra, you ask?  Well, he does come out as the 60th best OF when I run the 2014 Steamer projections through my ranking calculations.  He’s ranked the #83 OF in the FantasyPros consensus ranks.

Gerardo_Parra

It would seem that dropping 23 spots further should affect things significantly.  But let’s take a look:

Player AB H AVG HR R RBI SB
Holliday 530 152 .287 22 78 81 4
Castillo 365 92 .252 12 41 45 2
Total Team A 895 244 .273 34 119 126 6

Continue reading “You Need To Read This If You Play In a Two-Catcher League”

Locating Historic League Standings Information in Yahoo

One of the keys to using the Standings Gain Points method to valuing fantasy baseball players is having historic league standings from which to calculate your SGP factors.

I’ve learned that locating historic standings in Yahoo! can be difficult if you don’t use the option to continue your league and roll it forward from year-to-year.

If you do roll your leagues forward, you can easily access past years from the “Season” drop down menu on the league home page.

Yahoo_Baseball_Seasons

If you don’t see this option or want to access the standings from past seasons, check out these instructions below:

How To Access Old Yahoo League Standings

Step Procedures
1. Visit the league page for any current year Yahoo league.
2. Click on the “My Team” link on the main header of your league page.Yahoo_Fantasy_Baseball
3. Once on your team page, you will see your team name in larger font. Right below this team name you will see a hyperlink, in smaller font, to your Yahoo! fantasy sports profile.  Click this link (for example, see the “SFBB” link in the image below).Yahoo_User_Profile
4. Your Yahoo! fantasy sports profile lists information about your past performances, has a trophy case, and lists out each fantasy sports league you’ve played at Yahoo.Yahoo_Trophy_Case
5. It appears like Yahoo keeps your fantasy baseball league standings available indefinitely.  I can get back to final standings from leagues as far back as the early 2000’s.Yahoo_Fantasy
6. To access the standings for a specific league, click on the link for the league name.Yahoo_League
7. You’ll then see the summarized league standings.  To see the more detailed category totals and category standings, click on the “Full Standings” link in the header bar.Yahoo_Rotisserie
8. Wow, I had a good pitching staff that season.  The team-by-team point totals are presented at the top of the page.Yahoo_Final_Standings
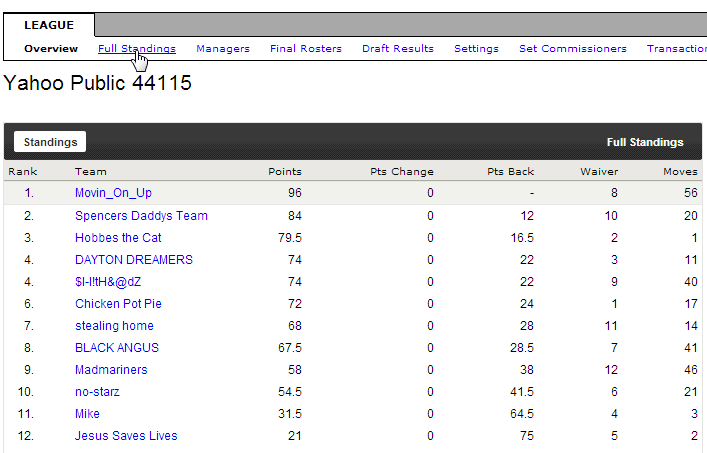
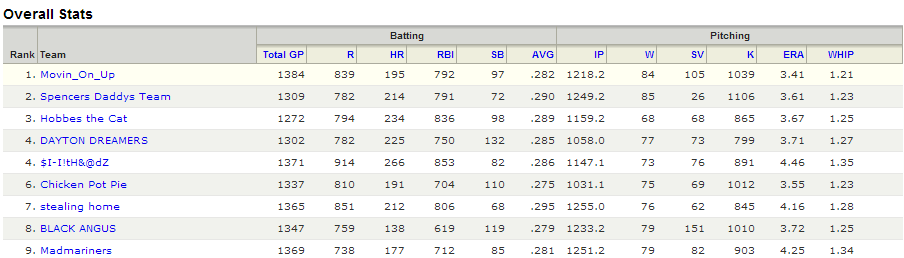
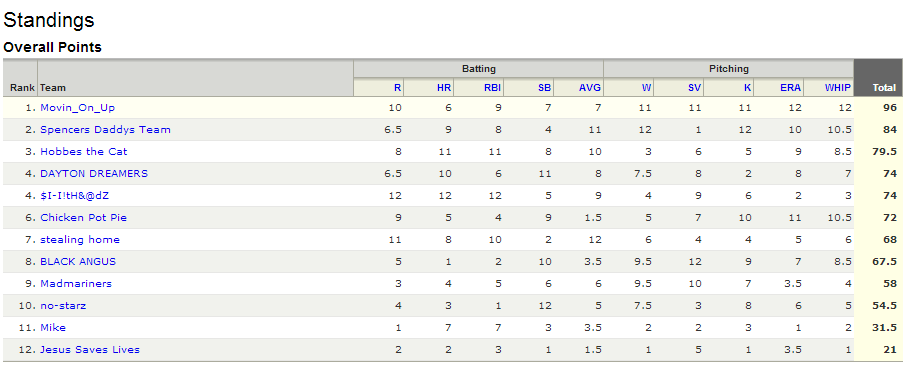
And the accumulated team stat totals are at the bottom.

Yahoo_Team_Stats

9. These are the figures you can enter into the “What It Takes To Win Your League” calculator to get a summarized look at the stats it has taken over time to win your specific league and to calculate SGP factors from.What-It-Takes-To-Win-Your-League

I’m Looking For Historic League Data

If you have used the “What It Takes To Win Your League” calculator and would be willing to provide me with the information, I’m looking to accumulate this data.  I’m mostly interested in non-standard league sizes and/or leagues that use non-standard statistics like OBP, OPS, K/9, Holds, Quality Starts, etc.

If you have this information available and are interested in helping out, please use the “Contact Me” page of this site to get in touch with me.

Thanks For Reading

Make smart choices.

2014 Rankings and Dollar Values Download Now Available

As draft day quickly approaches, I realize that not everyone will have the opportunity to work through the rankings and dollar value generation process from start to finish.  In order to accommodate people in this situation, the "Using Standings Gain Points to Rank and Value Fantasy Baseball Players" guide will now include an Excel download with the full ranking and dollar value process applied.

The Excel file includes the free Steamer projections available at Fangraphs.com.  The file is fully editable, but will come ranked according to a 12-team mixed league, traditional rotisserie categories and lineups (14 hitters, 9 pitchers).  You can use the guide to tailor this Excel file for your specific league settings and lineup configuration (the biggest adjustment you need to make is to determine the replacement level factors for each position).

Please click here to read more or to get your own copy of the this step-by-step guide for ranking players and calculating dollar values (and inflation!).

smartfantassybb_3d-500x635Or use the buttons below if you'd like to purchase the guide now for $9.99.

Buy Now View Cart

How To Calculate Auction Dollar Values and Account For Inflation

smartfantassybb_3d-500x635I’m very happy to announce that I’ve just finished the “missing pieces” to the “Create Your Own Fantasy Baseball Rankings” guide.

Parts 1 – 6, that walk you through the process of developing a league-specific ranking for each hitter and pitcher, will continue to be freely available here.

A fully comprehensive guide that includes calculating dollar values and incorporates calculations for keeper and in-draft inflation is available here.

This guide now goes up to 10 Parts:

  • Part 1 – Download Free Projection Data
  • Part 2 – Understanding Player IDs
  • Part 3 – VLOOKUP, Excel Tables, Named Ranges
  • Part 4 – Pitcher Rankings
  • Part 5 – Understanding Standings Gain Points
  • Part 6 – Accounting for Replacement Level and Position Scarcity
  • Part 7 – Understanding The Hitter/Pitcher Dollar Allocation
  • Part 8 – Converting SGPs into Hitter Dollar Values
  • Part 9 – Converting SGPs into Pitcher Dollar Values
  • Part 10 – Incorporating In-Draft Price Inflation and Keeper League Inflation

I’m very proud of this guide and believe it to be the best step-by-step guide to ranking players and calculating dollar values available anywhere.

Please click here to read all about the additions to the guide and how to purchase your copy.

Thanks For Reading

Good luck, as we approach draft season!  Stay smart.

Smart Elsewhere #8 – Fantasy Baseball Crackerjacks

You probably have gathered by now that I am not here offer much player analysis, sleeper talk, or draft breakdowns.  There is so much great information out there that I couldn’t possibly keep up (I have my nose too far buried in spreadsheets to write much).

Yet I do realize that spreadsheets and projections and conceptual talk I focus on can only take you so far.  At the end of the day, in-depth analysis, player profiles, rankings breakdowns, and draft prep information is extremely important to your success.

I can’t offer this myself.

But I do work with Fantasy Baseball Crackerjacks and they provide A TON of this high quality information.

My Role at Fantasy Baseball Crackerjacks

I used the methods documented here on SFBB to develop the projections used at Fantasy Baseball Crackerjacks.  I even write the occasional player profile, analysis, and strategy piece.  I’m very proud to be a part of the work they do at the site.  We just released the positional rankings and projections this week (see links below) and the other writers at the site pour out tons of interesting content.

Thanks For Reading

Stay smart!

How Do I Calculate SGP for Slugging Percentage?

Now that we’ve tackled calculating standings gain points for OBP, let’s give slugging percentage a try.

Again, special thanks are in order for reader Matt who also filled out the “What It Takes To Win Your League Calculator” with the last four years of history for the SLG category in his league.  You can see the data for ten teams listed below.

SLG_Standings_Gain_Points

How Many SLG Percentage Points Move You Up One Spot In The Standings?

Over the last four years, an average of .469 won the category and an average of .429 finished 10th.

.469 – .429 = .040 total spread between 10 teams

We have the data for 10 teams, meaning there are 9 spots you can move up in the standings by moving from .429 to .469 in team SLG.

.040 / 9 = .00444

On average, increasing your team SLG by .00444 points will result in you climbing one spot in the standings.

But I Play In A 12-Team League, Can I Use This Figure?

If you have an established league history with historic standings available to you, you can always calculate this yourself based upon your league’s specific history.

I don’t have specific evidence to support this, but I would venture a guess that limiting your SGP calculations to the top 10 out of 12 teams might be more beneficial than using all 12 teams.  This would minimize or eliminate the effect of teams that lose competitiveness or that tank the season.

What Formula Do I Use To Calculate The SGP For A Given Player?

Recall from Part 5 of the “Create Your Own Rankings” series, that you determine the SGP for a ratio stat, like SLG, by removing the effect an average player has on an average team, and then inserting the player you are ranking into the equation. Continue reading “How Do I Calculate SGP for Slugging Percentage?”

How Do I Calculate SGP for OBP?

I frequently get asked how to calculate standings gain points for the OBP category.  In this post I’ll give you an example of how to perform this calculation .

Full disclosure:  I don’t play in any OBP leagues.  

I know, I know.  You just lost a ton of respect for me and you’re considering leaving the site.  But I’m here to serve, so let’s figure this out together.

Before we begin, special thanks are in order for reader Matt who graciously agreed to fill out the “What It Takes To Win Your League Calculator” with the last four years of history for the OBP category in his league.  You can see the data for ten teams listed below.

Standings_Gain_Points_OBP

How Many OBP Points Move You Up One Spot In The Standings?

Over the last four years, an average of .356 won the category and an average of .335 finished 10th.

.356 – .335 = .021 total spread between 10 teams

We have the data for 10 teams, meaning there are 9 spots you can move up in the standings by moving from .335 to .356 in team OBP.

.021 / 9 = .00233

On average, increasing your team OBP by .0023 points will result in you climbing one spot in the standings.

But I Play In A 12-Team League, Can I Use This Figure?

If you have an established league history with historic standings available to you, you can always calculate this yourself based upon your league’s specific history.

I don’t have specific evidence to support this, but I would venture a guess that limiting your SGP calculations to the top 10 out of 12 teams might be more beneficial than using all 12 teams.  This would minimize or eliminate the effect of teams that lose competitiveness or that tank the season.

What Formula Do I Use To Calculate The SGP For A Given Player?

Recall from Part 5 of the “Create Your Own Rankings” series, that you determine the SGP for a ratio stat, like OBP, by removing the effect an average player has on an average team, and then inserting the player you are ranking into the equation. Continue reading “How Do I Calculate SGP for OBP?”

Taking Your Draft Spreadsheet To The Next Level

In this post I’ll show you how you can take a boring black and white spreadsheet and convert it into a visually meaningful piece of art in less than 10 minutes.

An important factor in being a skilled drafter is the ability to remain cool and calm in pressure situations. There may also be opportunities to intimidate some of your opponents during the draft, to give them the impression that you are highly prepared and ultimately familiar with the player pool and your own drafting strategy.

Nothing can accomplish these things better than a fancy color-coded spreadsheet.

There may be an element of hyperbole in that statement. But we have all been there. It’s late in the draft, you’ve already wasted 60 of your 90 second allotted time and you’ve just made the decision that you need to draft a second basemen with some power but that won’t kill you in batting average. Or you need a pitcher with good strikeout totals that won’t kill you in WHIP. Or some obscure shortstop is thrown out for bid in the auction and you can’t remember if he will help you with reaching your target goal in stolen bases.

Enter Conditional Formatting in Excel

Conditional Formatting in Excel allows you to give visual meaning to a mass of boring looking numbers that can be hard to interpret all at once.  Let’s face it, while looking at the spreadsheet example in the image below it is not easy to quickly make sense of the numbers.

Conditional_Formatting_Example

But if I take this same area and apply a few of the different conditional formatting rules to it, you can much more quickly make sense of what you are seeing:

Conditional_Formatting_Example2

In the “RSGP” column I have applied a rule in which you select two colors.  One color represents the highest value in the data selected and the other color represents the lowest value in the data selected.  I chose a standard green color for the highest value and white for the lowest.  Excel then automatically provides shades between white and green to each player’s “RSGP” based upon its value relative to all the other players in the list.  Whether you agree with me or not, I’m down on Billy Hamilton’s ability to stick at lead off for the entire year, and his run projection is the lowest of anyone captured in the screenshot.  So he’s the closest to white.  While Votto has the highest “RSGP” in this small group of players, so he’s shaded closest to green.

The “HRSGP” column has a rule using three colors.  Green is still used for the values that are greatest in this column.  Red is used for the lowest values,  And Yellow is used for values near the 50th percentile of the group.  Again, Excel automatically shades ever player’s value according to this set of instructions.  You simply select the three colors and Excel does the rest.  Here you can see Billy Hamilton is projected to be very low in “HRSGP”, while Jay Bruce and Chris Davis are much higher.  These two illustrate an important concept too.  I have Bruce projected to hit fewer home runs than Chris Davis, but Bruce comes out with a higher “HRSGP” based upon the positional replacement level adjustment under the SGP method.

The “RBISGP” is using data bars to depict the value of each player’s RBI compared to the group.  Not to keep piling on Billy Hamilton’s lack of hitting prowess, but you see he has a red bar pointing to the left, in his “RBISGP” column.  This indicates the magnitude to which his RBI projections are below 0.00 SGP.  Jay Bruce, right above him, has a very strong RBI projection and a blue shaded bar depicts this.

Conditional_Formatting_Example3

This Seems Way Too Complicated

It’s really not.  You can add this to your draft spreadsheet in under 10 minutes.

Things To Consider Before We Start

In the step-by-step instructions below, I apply conditional formatting to a player’s standings gain point (SGP) figure for each individual category (e.g. HR, BA, R, etc).  I choose to do this because after following the “Create Your Own Fantasy Baseball Rankings” approach, the final SGP figure for any player includes an adjustment for replacement level at the position.  This means that 15 HR from a 2B are valued more than 15 HR from a 1B.

The other benefit of applying the formatting to the SGP columns is that rate states like BA, ERA, and WHIP will be weighted appropriately.  An OF that might hit .300 but only get 200 PAs isn’t really helpful to our team BA.

There is an argument to be made that you would want to apply conditional formatting to a player’s raw statistics instead of the SGP figure.  After all, if you’re trying to draft players in order to reach a targeted goal (like 250 HR), you might be more interested in a 1B projected to hit 18 than the C projected for 17, even though those 17 from the C are more “valuable”.

Anyways, that’s beyond the scope of this post.  I’m just here to add fancy colors to your spreadsheet right now.  Just know that you can do this using a player’s raw projections even if you haven’t worked through the “Create Your Own Fantasy Baseball Rankings” series.

Step-By-Step Instructions

Continue reading “Taking Your Draft Spreadsheet To The Next Level”