Most of the concepts used in the standings gain points process of valuing players are straightforward. If there’s one facet of the process that causes the most confusion, it’s the handling of ratio statistics like batting average and WHIP. In the piece that follows, I’ll revisit the basics of what makes ratios statistics different and then I’ll get into two very specific and more complicated questions I often see.
- How do you determine the baseline (or league average) ratio to compare the player pool to?
- What if you don’t use an accurate measure for that baseline?
Counting Stats are Simple
A player cannot hit a “negative home run” or “lose strikeouts”. Each counting stat helps you move closer to the next team in the standings. So when we are calculating SGP for a player, the counting stats all evaluate out to a positive number. For example, if we determine based on 2017 standings that it takes 8.526 home runs to move up one spot in the standings, Dee Gordon’s two home runs still calculate out to 0.2346 standings gain points. They’re still beneficial in an absolute sense.
Ratio Stats are Messy
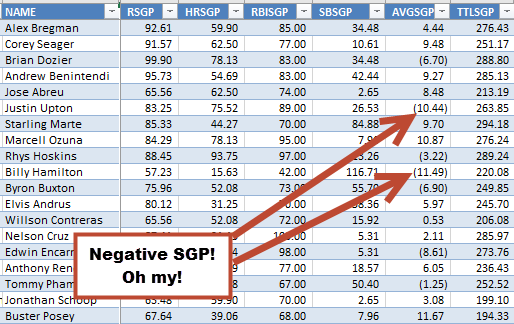
When it comes to rotisserie scoring of ratio stats, we are not judged in that same manner. A player with a poor batting average or a bad earned run average can lower your score within those categories. You can have negative ratios that cause you to lose points or fall in the standings. A player can have a negative SGP for a ratio category.

How Do We Calculate SGP for Ratio Stats?
NOTE: This part is a refresher. If you already have a general understanding of how this works, skip down to the next bolded heading.
Let’s revisit how we calculate things for ratio stats. Directly from my guide “Using Standings Gain Points to Rank and Value Fantasy Baseball Players” (with specific text emphasized):
If we assume a league of 12 teams and 14 hitters on each team (adjust for your roster size), that is 168 players (12 * 14). In the Steamer projections, the top 168 major leaguers are projected for an average of about 509 at bats per player.
This means the average team in this fantasy league will have approximately 7,126 at bats (14 players * 509 at bats). According to Razzball, the average rotisserie batting average in 12-team leagues was .267. This means the average team had approximately 1,902 hits (7,126 * .267). And the average player had 136 hits (1,902 team hits / 14 players).
To find the impact of Trout we need to remove one “average” player from the team and then add in Trout’s projections. We can do the same for Tulowitzki.
13 “average” players * 509 at bats = 6,617
13 “average” players * 136 hits = 1,768
Before I start getting into the intricacies of that process, it’s important to understand that the approach we use to calculate SGP for ratio stats is to find an individual player’s effect on that ratio stat for an AVERAGE team in the standings.
Here’s a closer look at how you would do this for batting average:
| Step | Description |
|---|---|
| 1. | You first need to know what your fantasy league’s average batting average was. In this example, let’s say it’s .267. |
| 2. | Determine what the SGP factor is for the ratio stat. In this example, let’s use 0.0019 (the raw factor for the 12-team Online Championships calculated here). |
| 3. | You then need an approximation of how many at bats it took to generate that average. In this example, I determined that 168 players (12 teams * 14 players per team) would average 509 at bats. (more on how this was determined later!) |
| 4. | Using that information, derive the number of hits the average player had. Knowing the league average and the number of at bats, we can easily figure out that the average player would have had 136 hits (.267 * 509 = 135.9). |
| 5. | Next, you extrapolate the 136 hits and 509 at bats per player to team totals. But not a full team of players. ONE LESS PLAYER THAN A FULL TEAM (PER YOUR LEAGUE’S SETTINGS). We’re trying to figure out what an average team looks like without the one player we’re trying to rank.
In this example of a 14-player roster, we’ll use 13 players (one less than a full team). This means the average team (minus one player) would have 1,768 hits (13 * 136) and 6,617 at bats (13 * 509). It’s CRITICAL that these two numbers hold true to your league average stat. Notice that 1,768 divided by 6,617 is still .267. |
| 6. | Then, you add in the projection for the player being evaluated and DETERMINE THE TEAM’S RATIO STAT WITH THAT PLAYER. Assume a player is projected for a .300 average on 200 hits and 667 at bats. The calculation would be:
= (1,768 hits + 200 hits) / (6,617 at bats + 667 at bats) = 1,968 hits / 7,284 at bats = .27018 AVG
|
| 7. | Finally, determine the effect of the individual player by subtracting the average team’s ratio (from step 1 above) from the recalculated team ratio with the player, then divide by the SGP factor.
In our example, this calculation would be:
= (.27018 – .267) / 0.0019 = 1.6737 SGP Instead of using a player with a .300 average, assume we used a player that dragged the team average down to .264. For this player, the SGP calculation would be:
= (.264 – .267) / 0.0019 = -1.5789 SGP Negative standings gain points! I said this cannot happen with counting stats… But it CAN AND WILL HAPPEN with ratio stats. |
How Do You Determine the Baseline (or League Average) Ratio to Compare the Player Pool to?
When you read through that description above, things generally make sense. But when you actually try to reperform that process, you’ll quickly realize I skipped some steps and take some liberties…


