And that’s a fair question.
Instead of going it alone, as I’ve done the last three years (has it really been that long already???), I’m now writing at the Rotographs section of Fangraphs. For the near future, you should be able to find a new article there, from me, every Friday morning. You can see an archive of what I’ve already written here.
Is SFBB Shutting Down?
No! While it will be difficult for me to continue posting here at the same pace, the site isn’t going anywhere. I do hope to add more spreadsheet tips and analysis here, and you will also be able to find that in my writing at Rotographs.
I’ve already snuck in a couple of Excel pieces over there and haven’t gotten fired yet!
SmartFantasyBaseball will also be my home for the tools, spreadsheets, and guides that I create. The Player ID map and any serious “how to” lengthy series (like my standings gain points and points league series) will be here.
One major benefit of the Rotographs shift is that I will be publishing something EVERY WEEK! I used to aim for only twice a month.
My Work So Far at Rotographs
Here’s a short summary of the pieces I’ve already published over there:
-
A Look at 2015 AL-Only Standings Data – Thanks to the fine folks at OnRoto, an analysis of 76 different 12-team AL-only leagues, including the average final standings, statistical category targets to shoot for, standings gain points calculations, and average hitter and pitcher stats for each roster spot. Click here to read the article. Includes a link to an Excel file download and a Google Sheet document of the raw data.
-
A Look at 2015 NL-Only Standings Data – OnRoto provided the data for 51 different 12-team NL-only leagues. I converted that information into category targets to shoot for, SGP calculations, and average stats required from each hitter and pitcher. This one also includes a link to an Excel file and a Google Sheet of the raw standings information.
-
Why You Should Aim for Third Place – This sounds rather defeatist, but I took 30 NFBC leagues’ standings data and charted out all of the results. What I found is that aiming to finish in third place in each rotisserie category looks to be the optimal use of your resources during the draft.
-
Making Simple Edits to Projections for R, RBI, and PA – Have you ever wondered what the effect of hitting in different spots in the lineup has on runs and RBI? Well what if the player is in the AL? Does that matter? Or what if he’s on a team projected to score 650 runs? What if he’s traded to a team that will score 750? This post comes with a series of handy charts that can help you quickly answer questions like these.
-
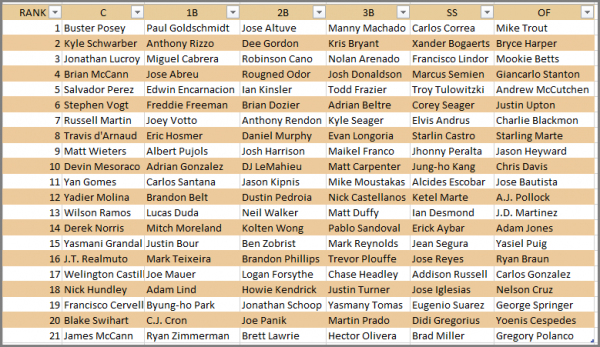
How to Create a Position Cheat Sheet in Excel – Step-by-step instructions on how to add a cheat sheet, like the one shown below, to your Excel file.

-
Properly Valuing Hitters with Injury Risk – Follow along as I attempt to value players, like Giancarlo Stanton, perceived to have a large amount of injury risk associated with them. What is the proper way to make this adjustment? How big of an affect does it really have?
-
How Does Batting Order Affect Stolen Bases – A closer look at how stolen base attempts are affected by where a player hits in the lineup. Do you need to worry if your speedster is being moved to third in the lineup? Can you expect a slow base runner to steal more if he’s moved into the leadoff spot? Answers to these questions and more!
-
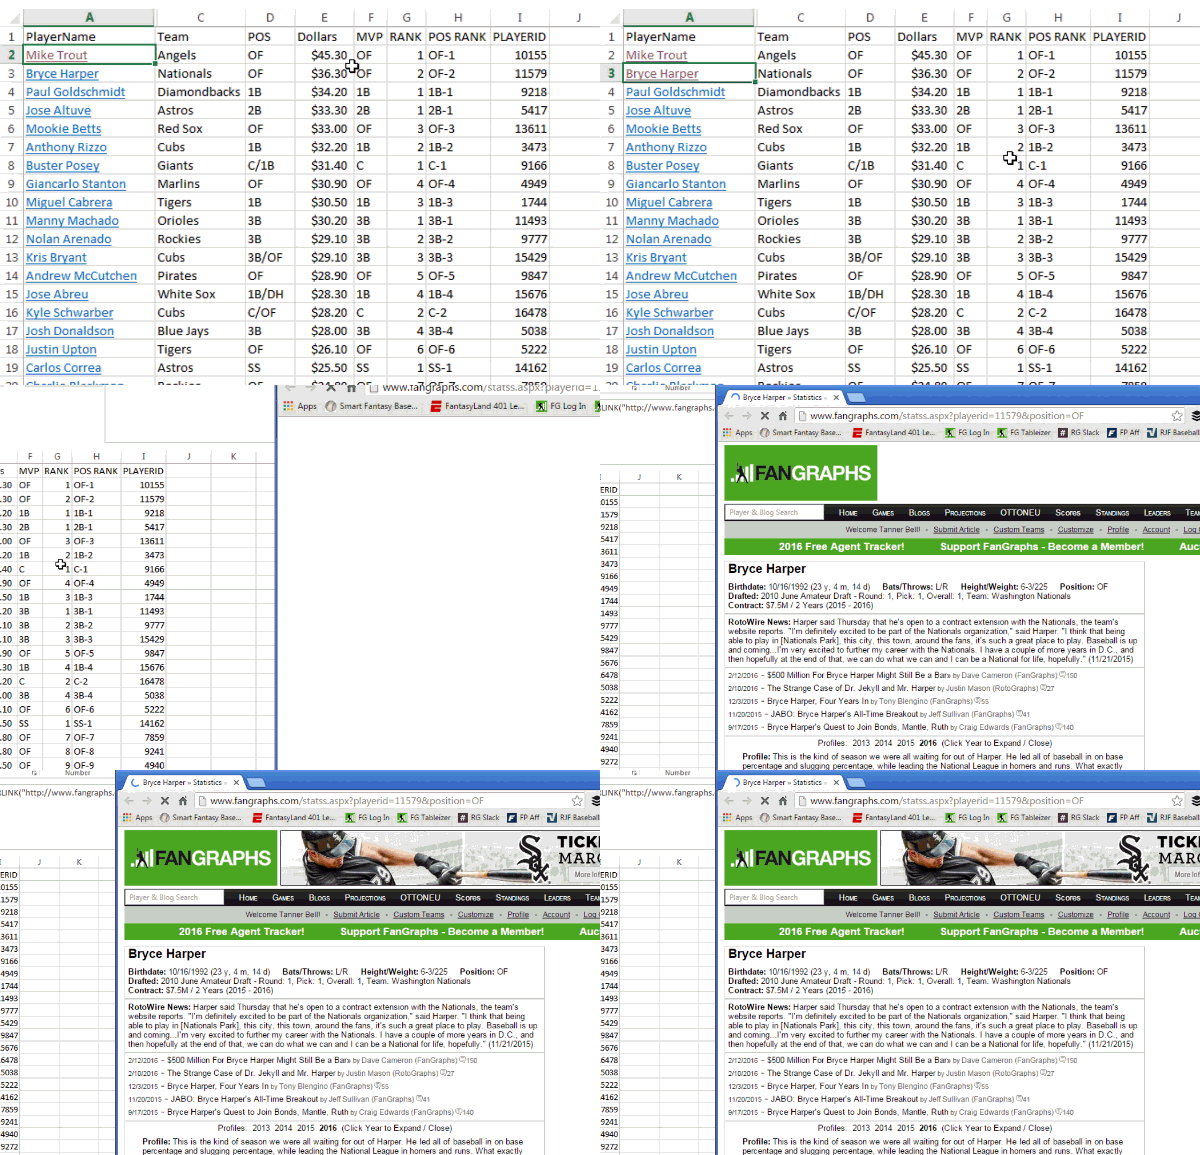
How to Add Player Page Links to Your Draft Spreadsheet – Another handy feature to add to your draft spreadsheet. Adding these clickable links to your file will help you look up players on Fangraphs quickly and easily during the pressure-filled draft.

- Tanner Bell’s 10 Bold Predictions for 2016 – Making player predictions and going out on a limb for guys is not my M.O. But it was fun participating in one of my favorite annual Fangraphs traditions. Gerardo Parra, Jose Altuve, Marcell Ozuna, Lorenzo Cain, and more (some good, some bad)!
Stay Smart
Best of luck this season. Be sure to follow me on Twitter so we can keep in touch and so you can be kept up-to-date on new tools and articles.
Tanner, Big fan of your work, here and now also at Rotographs! I had a question regarding your RG post, “How to create a position Cheat Sheet in Excel,” but it does not seem possible to post responses on RG (maybe due to the age of the article?) So I am hoping this post finds its way to you.
I am trying to add the Cheat Sheet to my spreadsheet built according to your SGP based how to series. Since I also hope to track drafted players via Conditional Formatting (thanks for that article also!) I linked the FNAME, LNAME and ROTOTEAM columns in my main spreadsheet. I managed to manipulate the formulas to link up, so Posey shows up at the C-1 position.
The issue I am having is that I am in an NL Only league. I hide the AL players by filtering the TEAM options. But when I fill down the catcher column in my Cheat Sheet, all the hidden AL players are included. Is there a way to bring only NL players into the Cheat Sheet? (I realize I could sort by TEAM and then delete the AL players, but that is more last resort as trades and waiver signings still occur this time of year and I like having everyone in the system so if I change a BAL to an SD and update the TEAM filter the new player is added seamlessly into the spreadsheet. Any ideas?
Thanks, and keep writing! -Kris in Wormtown
Hi Kris,
It will depend a little on how you created your spreadsheet. The Player ID Map has a column for “League” on it. The values there are either “AL”, “NL”, or “N/A” if the player isn’t listed on a team.
You will want to bring this “League” column over onto your Hitter Ranks and Pitcher Ranks tabs, just like you bring over the player’s team and position.
Then the formula in your statistic VLOOKUP columns will be something like this:
=IF([@LEAGUE]=”NL”,YOUR_EXISTING_VLOOKUP_FORMULA,0)
This formula will only pull the player’s projection if they are listed as an NL player. The AL players will show as having no stats. This should make them fall to the bottom of the list. But if one were traded to the NL, you’d only have to change his team to show he’s now in the NL and his stats will pull automatically.
Hope that helps.
Tanner
Thanks, Tanner! Had never noticed the “LEAGUE” column. I had a few challenges tweaking the formulas but I got it to work. Now I’ll try to integrate Conditional Formatting into it. But even if I cannot get it to update automatically, it still serves as a useful cheat sheet, and took no longer than if I did a text only cut-and-paste sheet!