I’m an SGP guy. Standings gain points are what I first learned. The approach has been good to me. And it seems I’ve been fairly successful using the approach. But SGP has a weakness. It’s a big weakness that prevents a lot of fantasy baseball players from using the approach.
Where Can I Get Reliable SGP Data?
Where can I find historical SGP data??? This is one of the most common questions I get about the use of standings gain points. If you’re starting a new league, don’t have access to league history, or switched website providers, you’re screwed. You can’t really start using SGP. And let’s not even mention those of you that play in AL or NL-only leagues (I still don’t have an answer for that, sorry).
In this post I’ll share with you where and how you can get great quantities of actual league standings in competitive mixed leagues (again, sorry mono-leaguers, I would love to help you one day but I haven’t found out how yet).
I got the idea to do this by reading Jeff Zimmerman’s fantasy draft prep series in 2014 and 2015.
Where Can You Find Standings Information for Competitive Leagues?
I haven’t proven the theory yet, but I’m pretty certain you could write some kind of web scraping program to pull down the standings information for public Yahoo! and ESPN leagues. But who knows what the level of competition is in those? You would have to find a way to weed out the non-competitive leagues and teams to prevent those that draft and then never change their lineup the entire season from distorting the standings information.
Enter the National Fantasy Baseball Championship (NFBC)
The National Fantasy Baseball Championship (NFBC) is the industry leader in premium fantasy baseball leagues. Meaning leagues that people pay an entry fee to join in an effort to win prize money.
The fact that people are paying money to enter these leagues and that prize money is at stake is the best mechanism we could hope for to ensure competitiveness. The standings information will not be tainted by schleps that draft a team and abandon in after the first week of the season.
Not only that, but the NFBC also publishes final league standings by category and makes them available to anyone! This is an SGP jackpot.
Different Types of Leagues
The NFBC has several different competitions. The two most likely to be of value to us are the “Online” and “Draft Champions” leagues. These leagues have the most entrants, so we can reduce concerns over small sample sizes. Here’s a summary of the two league types and links to the standings information for them:
| NFBC League Type | Standings Links | Description of League |
|---|---|---|
| Online | Overall Standings BA, R, HR, RBI, SB ERA, WHIP, W, K, SV |
|
| Draft Champions | Overall Standings BA, R, HR, RBI, SB ERA, WHIP, W, K, SV |
|
So the big differences to note are that the “Online” leagues have 12 teams and a 30 round draft. The “Draft Champions” leagues have 15 teams and have 50-round drafts because they don’t have free agency during the season. We’ll a look at this in future posts to see if it seems to affect things.
Now That We Have This Information, What Do We Do Next?
There were 125 leagues and 1,500 teams in the 2015 Online NFBC leagues and 192 leagues and 2,880 teams in the 2015 Draft Champions leagues.
That’s a lot of data. Is there a practical way to take all of that data and use it to calculate SGP factors? Of course!
You’re Boring Me and I Don’t Want to Do This Myself
NOTE: I’m about to go through instructions how to calculate the NFBC SGP numbers yourself, but if you just want my completed analysis, you can download them here:
- 2015 NFBC Draft Championship SGP Data
- 2015 NFBC Online Championship SGP Data
- 2014 NFBC Draft Championship SGP Data
- 2014 NFBC Online Championship SGP Data
- 2013 NFBC Draft Championship SGP Data
- 2013 NFBC Online Championship SGP Data
I may not update this information every year into the future… So remember, the instructions below will remain so you can do this yourself!
Excel Functions Used in this Post
We’ll be using the SLOPE, IF, and AVERAGEIFS formulas to calculate SGP for the NFBC leagues.
SLOPE
You can read more about the SLOPE formula in a three part series I wrote about here, here, and here.
The short description is that the SLOPE function finds the line of best fit through a given set of data points. With our rotisserie standings data, the SLOPE formula essentially calculates the actual SGP factor or denominator. I’d highly suggest reading the three part series. Or at least Part I!
IF
The IF function checks to see if a condition is met. If the condition is met, the function returns one response. If the condition is not met, the function returns another response. One important fact to realize is that the responses you specify in the IF formula can be formulas. So if the condition you specify is met, you can have the cell use formula A. And if the condition you specify is not met, you can have the cell use formula B.
The function requires three inputs:
- Logical_Test – This is typically a formula to be evaluated. An example might be “is cell C2 greater than cell D2”.
- Value_If_True – This is the value to be shown or the formula to be evaluated if the Logical_Test is passed,.
- Value_If_False – This is the value to be shown or the formula to be evaluated if the Logical_Test is failed.
AVERAGEIFS
The AVERAGEIFS formula will calculate the mean of groups of cells that meet a set of conditions. You can specify multiple groups of cells and multiple conditions that must be met. The function requires three inputs (but can use more…):
- Average_Range – These are the cells to be included in the calculation of the average
- Criteria_Range1 – This is the first set of cells you want to be evaluated for the condition
- Criteria1 – This is the condition that must be met for the item in the Average_Range to be included in the calculation of the average
- If you have more conditions to be evaluated, you can continue to add pairs of Criteria_Range2 and Criteria2, Criteria_Rang3 and Criteria3, etc.
This is a little vague until I tell you more about how we will design this spreadsheet to work.
Our goal will be to design a spreadsheet containing a separate tab for each rotisserie scoring category.

And one tab that will analyze each scoring category and calculate the average needed to finish in each place for that category. For example, this table will show what the average batting average was for each of the 15 places in an NFBC Draft Champions league.

Each cell under the roto categories will contain an AVERAGEIFS formula. For example, the table tells us that first place in the Batting Average category had an average of 0.277. The formula in this cell is set up to look on the “BA” tab for the batting average of each team (the Average_Range), then look in the “Place in League” column (the Criteria_Range1) for any rows with a “1” in them (the Criteria).
That 0.277 calculation is the average of all (and only) first place teams.
Step-By-Step Instructions to Calculate SGP for NFBC Leagues
In the instructions that follow I’ll be calculating the SGP factors from the 2015 NFBC Draft Championship standings data.
| Step | Description |
|---|---|
| 1. | Start a new Excel file and create the following tabs in the spreadsheet: “SGP Data”, “BA”, “R”, “HR”, “RBI”, “SB”, “ERA”, “W”, “WHIP”, “K”, and “SV”. |
| 2. | We’ll start by creating the area that will summarize and interpret the standings data we download from the NFBC website.
Enter the following information on the “SGP Data” tab (I listed “Rank” up to 15 because I’m using the Draft Championship in my example). |
| 3. | Now we’ll go to the NFBC site and copy the standings information for the various categories. Here are the links to standings information for the various categories in the NFBC Online and NFBC Draft Champion Leagues:
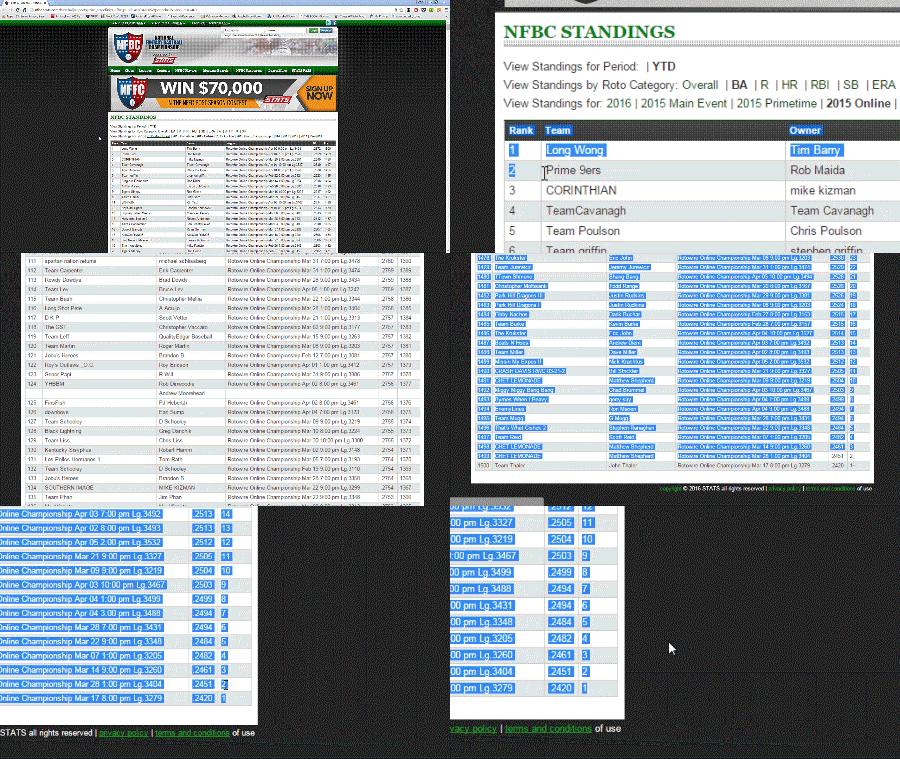
Online Hitting – BA, R, HR, RBI, SB Again, I’m using the Draft Champions information. I’ll start with the “BA” category and click the link to be taken to the NFBC page listing the BA data. To copy the data, carefully click your mouse before the word “Rank” in the top left of the standings data. Then hold your mouse button down and drag it toward the bottom right of the table, in order to select all the information. Then right-click on a selected piece of data and “Copy” it. |
| 4. | Return to the Excel file and click on the “BA” tab.
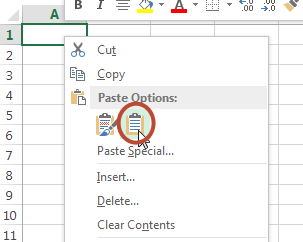
Paste the data you just copied into cell A1. But you’ll want to do a special type of paste so the formatting from the NFBC website doesn’t come over into Excel. In the right-click menu, choose the “Paste – Match Destination Formatting” menu option (or you could do a “Paste Special” and choose the “Text” option). Next, we will format the data as an Excel table, just as we did in step 2 above. Be sure to check the “My table has headers” box. |
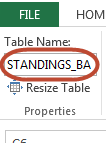
| 5. | Now name the table so we can more easily refer to this data for calculation of our standings gain points data. To do this, click the “Table Tools Design” tab of the ribbon. This menu will only show up when you have selected a cell within an Excel table.
Then adjust the “Table Name” field all the way to the left side of the “Table Tools Design” tab. Enter the name “STANDINGS_BA”. |
| 6. | Repeat steps 3, 4, and 5 above with the other categories (R, HR, RBI, SB, ERA, WHIP, W, K, SV).
Name the tables in Excel as follows: |
| 7. | At this point you should have ten tabs of NFBC data. One for each of the ten roto categories. If you look closely at the data, it’s sorted in such a way to rank a team among all other NFBC team in the Draft Championship league type.
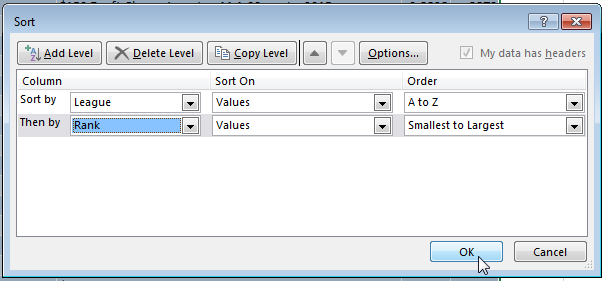
But we want to sort the data in a way that will bring all teams from the same league together in the list. And we then want to sort the teams within the league in order. To do this, click the “Sort” button on the “Data” tab of the Excel ribbon. Adjust the “Sort” dialog box as shown in the image below. We will first sort by “League” in order to bring all teams from the same league to be next to each other in the list. We will then sort by “Rank” in ascending order. This will put the top teams to the top of each league. |
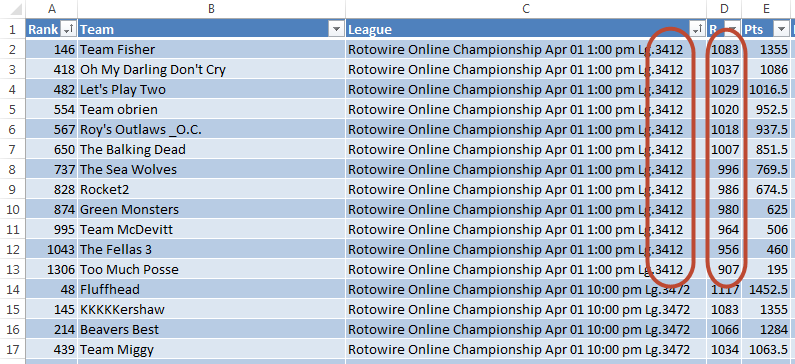
| 8. | The sort also has the side effect of moving co-managers down to the bottom of the list (some NFBC teams are owned or managed by more than one person). These names fall to the bottom because co-managers are listed below the first manager and no other standings data appears on these rows. 
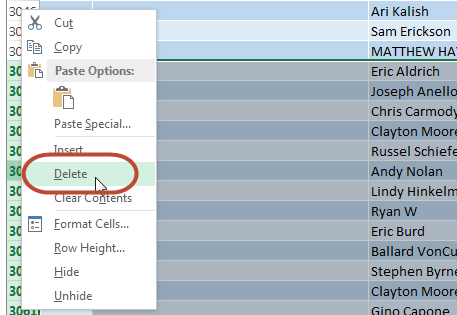
Remove these rows by clicking your mouse on the row numbers to the left of column A. Hold the left mouse button down and drag it to select all of the rows containing co-manager names (in my NFBC Draft Championship data I had to delete from row 2,882 to row 3,061. After you have selected the rows to delete, right-click within the selected rows and choose the “Delete” menu option. Perform this step on each tab of standings data (BA, R, HR, RBI, SB, ERA, WHIP, W, K, SV). |
| 9. | Return to the “BA” tab.
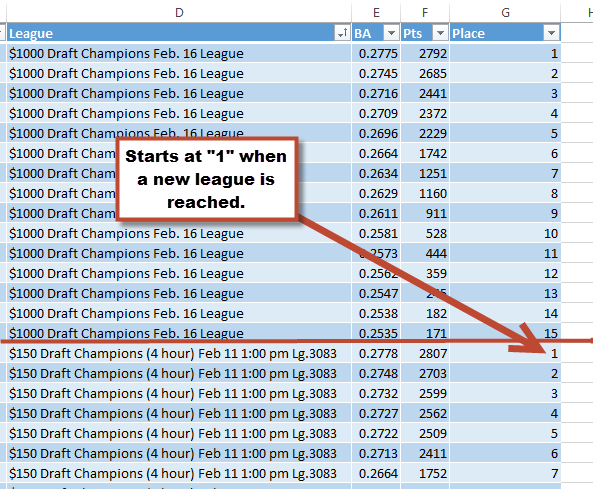
If you look closely at the sorted data for each category, you should notice we’re missing an important piece of information. The sorting brought all teams in the same league next to each other. And then it put the teams in order of finish within that category. But it would be helpful to see a column showing “place in the league”. To add this column, type “PLACE” at the top of column G. After you hit enter, the column should automatically become part of the table. Now enter the following formula in cell G2:
Let’s look at what this is doing.
In plain English, if cell D2 is equal to D1 (if this row relates to the same league as the row above), add one to the row above (in column G). If this row does NOT relate to the same league (if this is the first team listed for the next league), return a “1”. Select or click on cell G2 once again. Copy this formula to all rows in the table by double-clicking on the small square in the corner of cell G2. You should see that this “PLACE” column is properly ranking the teams within each league. Once the list of teams reaches another league, the “PLACE” column starts over at “1”. |
| 10. | Repeat step 9, adding the “PLACE” column, for all of the other category tabs. |
| 11. | Now comes the fun part. Go to the “SGP Data” tab and select cell C2, the cell representing first place in the BA category.
We’re about to use the AVERAGEIFS formula to calculate the average BA for all first place teams in this NFBC competition. Type the following into the cell (keep reading to the end of this step for a tip on how to enter formulas like these):
Or this is the same as:
Think back to the three inputs to the AVERAGEIFS function. The first is the Average_Range. In this example we want to take the average of items in the “BA” column of the “STANDINGS_BA” table. The second argument is the CRITERIA_RANGE1, or the column we want to test for meeting a certain rule. In this example we want only want first place teams, as indicated in the “PLACE” column of the “STANDINGS_BA” table. And the third argument is “CRITERIA1”, or the rule we want to test CRITERIA_RANGE1 for. The “[@RANK]” reference tells Excel to look in the “RANK” column for this current row that’s selected. In this case, that’s a “1”. All of this means that any batting average on the “STANDINGS_BA” tab will be included in our calculation if there is a “1” in the “PLACE” column. The formulas for the R, HR, RBI, SB, ERA, WHIP, W, K, and SV categories are as follows:
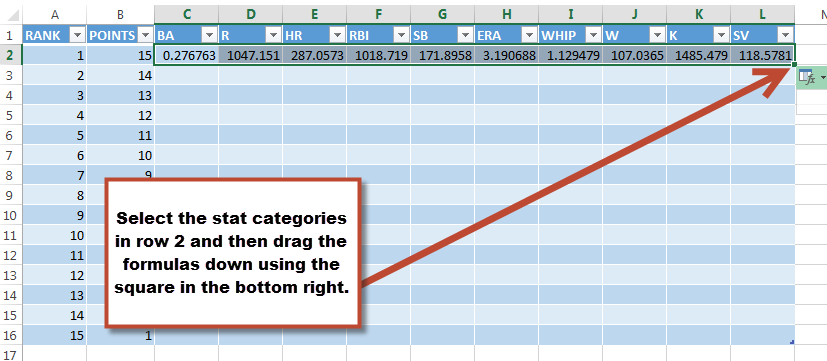
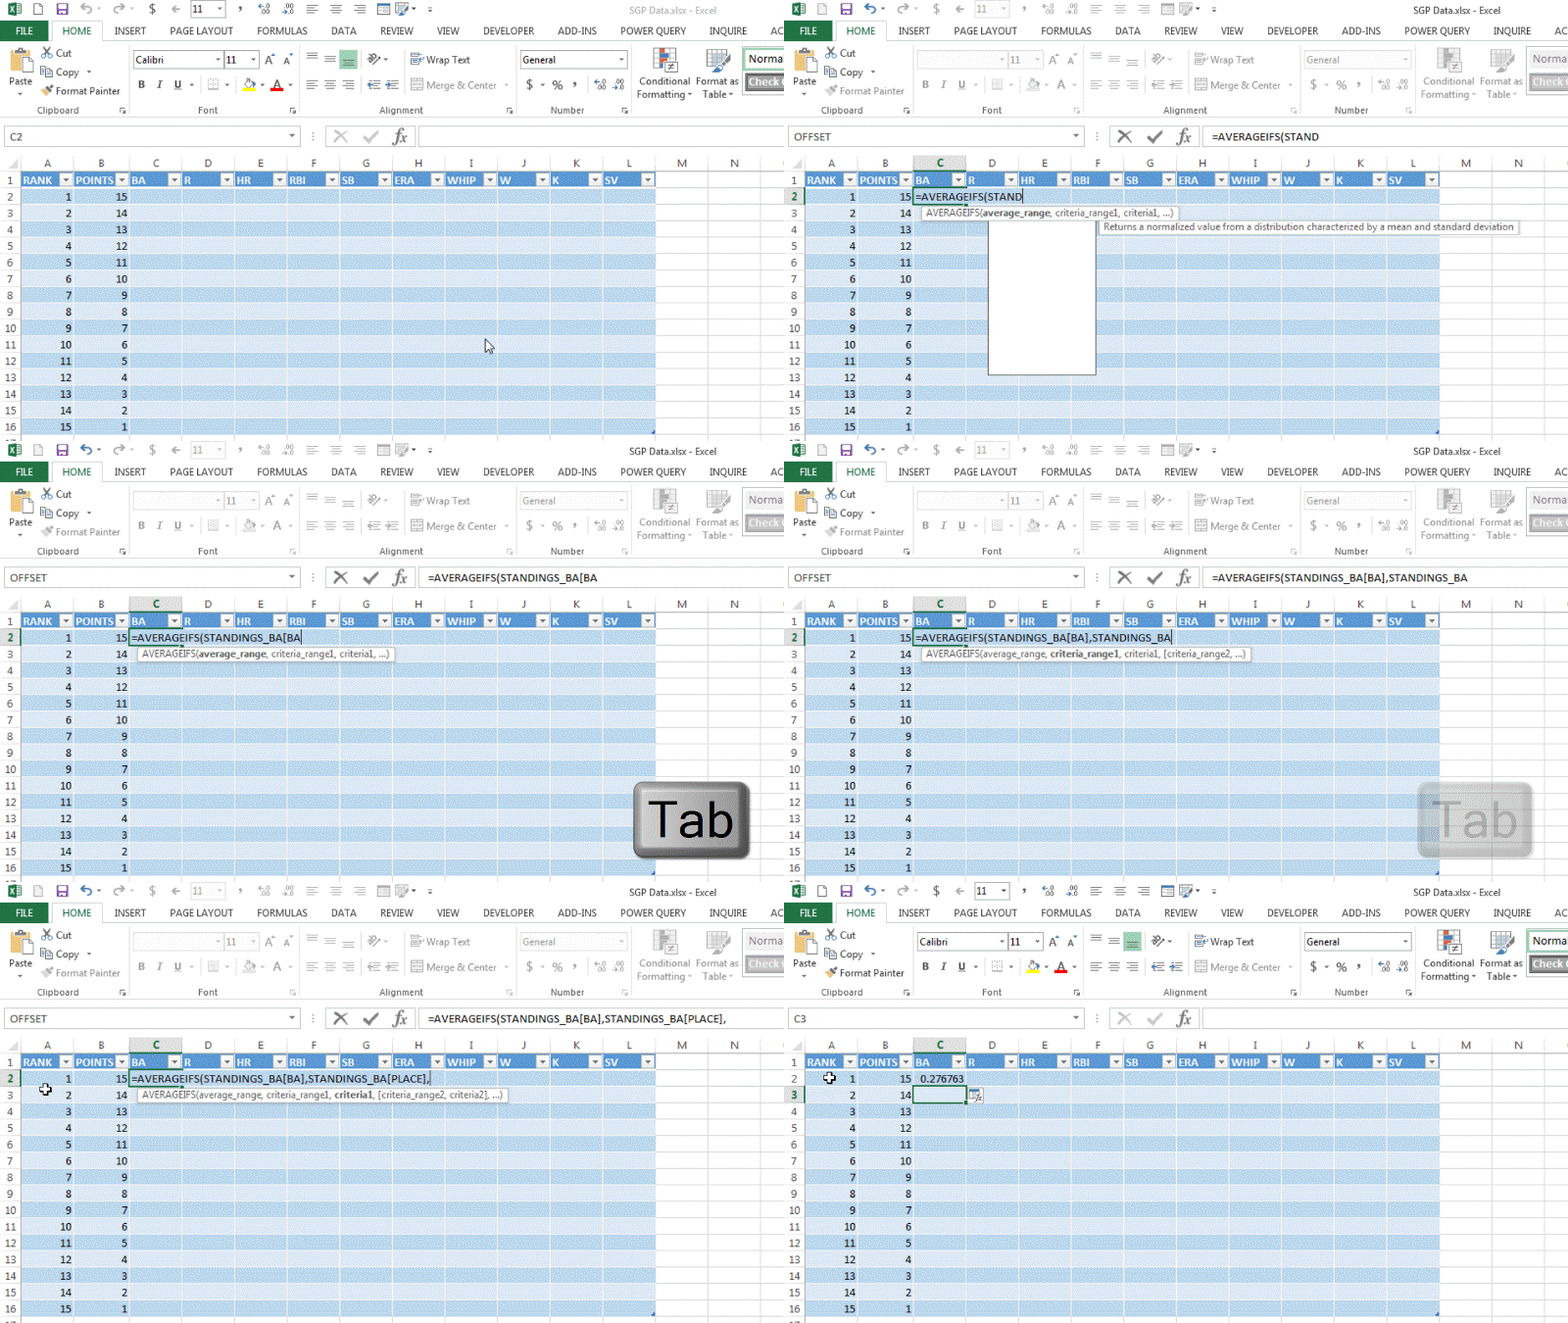
Enter these formulas into row two of the applicable column. Then select the cells shown below and drag the formulas down to the rows below. Excel Tip – One of the main benefits of using Excel tables is that Excel will recognize the names of these as you are typing in formulas. Watch the animation below for an example. When you type “STANDINGS_” into a formula, Excel should list out all the standings tables in the Excel file. To select one, hit “Tab”. Once you’ve selected a table (e.g. “STANDINGS_BA”) and type in an open bracket, “[“, Excel will list out all the columns within that table. You can then use your arrow keys to cycle up or down the list. And hit “Tab” to select one. |
| 12. | Spend a minute formatting the cells in the stat category columnns (e.g. show three decimals in the BA column, and show two (or none) in the other columns. Review your data to make sure it makes sense. You should see the categories descending (or increasing for ERA and WHIP) as the “RANK” changes. 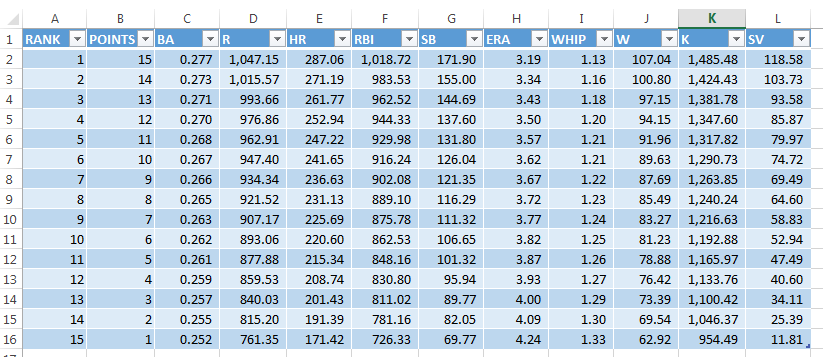 |
| 13. | These averages would be useful by themselves, But let’s finish this project by determining what the SGP denominators/factors should be.
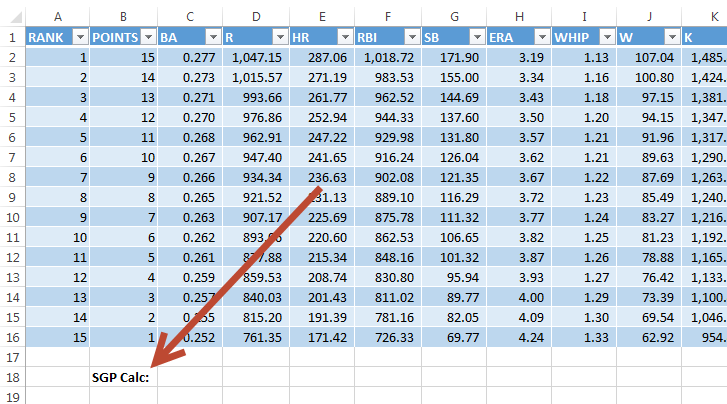
Type “SGP Calc” in a cell below the standings information (you’ll want to be at least two rows below the data so this information isn’t pulled into the table itself). |
| 14. | Enter the following formula in that same row but below the “BA” column:
This is the SLOPE formula, mentioned above, that calculates the line of best fit based on all the standings information in the table above. The result of this calculation is your SGP factor/denominator! That formula is setup so it can easily be dragged to the right and applied to all the other roto categories. And you should now have a finished product showing that average standings for all the NFBC leagues AND the SGP factors associated with those standings! |
Example Files to Download
If you’ve made it this far and don’t want to go scouring back up this post for the other example files I’ve created, here you are:
- 2015 NFBC Draft Championship SGP Data
- 2015 NFBC Online Championship SGP Data
- 2014 NFBC Draft Championship SGP Data
- 2014 NFBC Online Championship SGP Data
- 2013 NFBC Draft Championship SGP Data
- 2013 NFBC Online Championship SGP Data
What Does All Of This Data Mean?
We just unearthed a great deal of data. If you’re like me, this seems valuable, but you’re probably full of questions at this point.
“Where do we go from here?”
“Why the eff don’t my SGP factors look like those ones?”
“Can I use these? They seem more reliable than the data I have from my league that’s only been around two years.”
“What if I play in a 13-team league?”
So stay tuned! I have plans to dive into this data and answer questions like these as we continue to prepare for the 2016 season.
If you have a specific question you’d like addressed, please leave it in the comment area below
Please Do Me a Favor!
If you found this article helpful and would like to see more like it, please do something to support the site.
This can be something simple and free, like following me on Twitter.
Or you can register for the site using the sign up box below (I won’t share your e-mail with anyone and I rarely e-mail more than once a month).
Or if you liked this post, you may like my book, “Using Standings Gain Points to Rank and Value Fantasy Baseball Players“.
Alright. Enough pandering…
Thanks for reading. Stay smart.

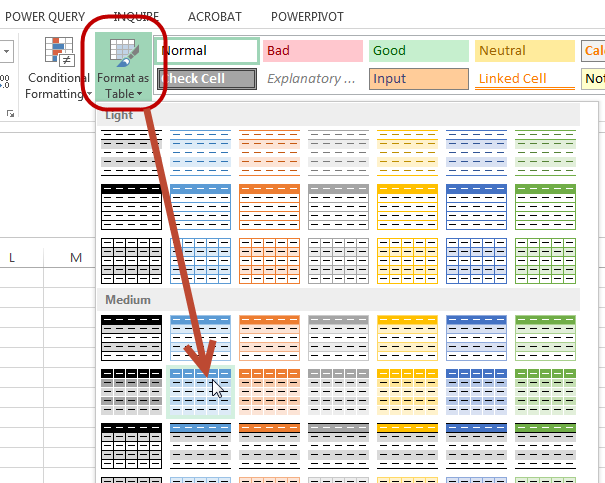
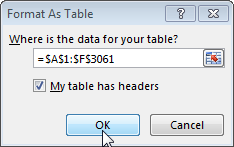
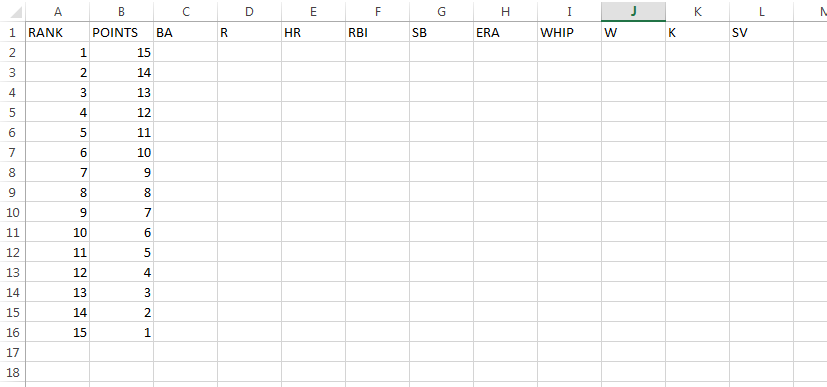 Then click once to select cell A1. And then click the “Format as Table” drop down menu and choose a desired format for the table.
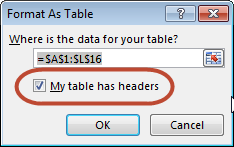
 Excel should select the table we’ve created. Make sure the “My table has header” box is checked and click “OK”.







Tanner awesome write up. My buddy and I are doing a $400 draft and hold league and I was trying to use your original Create Your Own Rankings guide and I got stuck with the SGP. This helps out a ton!
Thanks, Mike! Good luck in the league.
Maybe I’m wrong, but isn’t it a bad idea to use other league data. SGP caters to your history by analyzing the trend of category stats for how your league build their teams. When you pull vast averages from other leagues, you are using their trends instead of how your league trends.
That seems like a bad path to go down. Am I I wrong?
My league trends change from one season to another. For example in HR alone, the slope was 8.7, 10.5, 11.2, 10.7, 11.1 and in 2015: 11.7. Of course, I can trust my average slope over all those seasons of 10.6 or trust the last 3 seasons (11.1), or use a marcel weight on the last 3 seasons (11.25), or trust the NFBC of 8.42 (converted to a 10 team league = 10.10). The truth is that I can use any of these, they’re all pretty close to each other. But since my league is trending up I like the idea of using Marcel. For those who don’t know what that is, you weight the last season the most. =((11.7*5)+(11.1*4)+(10.7*3))/12 — 12 equals the weights added up (5+4+3 = 12).
The point is, aren’t you better off focusing on your history verse pulling averages from other sources? If I’m wrong and averages are a good starting point, then why aren’t they more readily available for use? For that matter, look at how much they have changed from your blog on SGP in 2014, HR denoms were 10.0, 10.4 from Razzball… and for 2015 NFBC Online for 2015 its 8.4. Almost 2 full points different, that’s a big swing in SGP totals. These numbers do matter, because they are being used to quantify the player’s value. So to use SGP as a primary valuation method, they need to be as accurate as possible… am I correct?
I do love this site… great stuff as always Tanner.
Hi Jason, you ask a very good question.
When I wrote this article, I intended for it to be something those without sufficient (or any) league history to use. Some folks switch leagues, just start playing, or are just trying to learn SGP for the first time and can’t locate prior year data. So I wanted to provide them with something that seems more reliable than just my own league observations.
Coming into this, I also would have agreed with everything you said. That you’re better off using your own league history because then the values are tailored to your specific league’s tendencies.
But I’m very close to publishing my next piece that is not fully supporting those themes. Even though three different roto leagues might have HR SGP denominators of 10.0, 10.4, and 8.4, the end dollar values will be closer than you’d think.
Thinking about this in another angle. Assume you’re in a 12-team league that you’d consider “semi-competitive”. I could see an argument for using 12-team data from the “highly-competitive” setup of the NFBC format over your own history. For two reasons. One being that a team designed to win a “highly-competitive” league should also be able to win in a “semi-competitive” environment. And second, using NFBC data will eliminate a lot of the noise and statistical variation that must come from only three years of history from a single league.
I’m more speculating on this last paragraph. I haven’t looked into it at all yet. But they’re just concepts I’m wrestling with in my head.
The post I referenced earlier should be coming very soon.
Thanks for the well-thought question. It’s fun to think about these topics.
That post is live now: https://www.smartfantasybaseball.com/2016/01/how-to-analyze-sgp-denominators-from-different-sources/
http://vigilantebaseball.com/2013/05/fantasy-math-calculate-roto-points-from-statistical-projections/
Thank so much for doing this! This is incredibly helpful. Small edit on the 2015 draft champions spreadsheet. On the wins tab, the entry DOUGHBOYS $150 Draft Champions Nov 20 1:00 pm Lg.2977 is in there twice.
You’re welcome! Thanks, Keith. I’ll take a look at that and try to get it fixed.
Tanner,
I have yet to find a post on your site that is not useful, so thank you so much for these articles. As a fantasy baseball newby your articles make a lot of terms and calculations easy to understand, and as such make FB more fun!
Dealing with the same problem as mentioned in the comments above (not having any historical SGP data) I am currently working on a Tableau report that shows player SGPs based on multiple data sources (2.14 season, 2015 season and multiple 2016 season projections) and user set SGP values. I will let you know when the first version is up and running, as I would love for you to have a look and provide feedback.
Cheers,
RJ