Welcome to the first part of a series in which we’ll go step-by-step through the process of using Microsoft Excel to calculate your own rankings for a fantasy baseball points league (as opposed to rotisserie or head-to-head rotisserie).
Whether you’re in a standard points league at a major site like ESPN or a more advanced Ottoneu league at Fangraphs, this process will help you develop customized rankings for your league. These instructions can be used for a season-long points league or a weekly head-to-head points league.
If you’re looking for info on how to rank players for a roto league, look here.
I recommend going through all the parts of the series in order. If you missed an earlier part of this series, you can find it here:
Please note that this series has been adapted into a nine-part book that also shows you how to convert points over replacement into dollar values and how to calculate in-draft inflation. Click here if you’re interested in reading more about the conversion to dollar values.
ABOUT THESE INSTRUCTIONS
- The projections used in this series are the Steamer 2015 preseason projections from Fangraphs. If you see projections that you disagree with or that appear unusual, it’s likely because I began writing this series in December 2014, still early in the off-season.
- For optimal results, you will want to be on Excel 2007 or higher. Some of the features used were not in existence in older versions.
- I use Excel 2013 for the screenshots included in the instructions. There may be some subtle differences between Excel 2007, 2010, and 2013.
- I can’t guarantee that all of formulas used in this series will work in Excel for Mac computers. I apologize for this. I don’t understand why Excel operates differently and has different features on different platforms.
IN PART 6
In this part of the series we will discuss the concept of replacement level, prove that it can lead to better decision making, demonstrate how it is an objective measure for making positional scarcity adjustments, and then incorporate replacement level adjustments for each position into our projected point values.
Accounting For Replacement Level
Heading in to the 2015 season, Ryan Braun is projected by Steamer to produce 82 R, 25 HR, 82 RBI, and 13 SB (or 752 points in my example league). Buster Posey is projected for 69 R, 19 HR, 75 RBI, and 1 SB (681 points).
Braun’s raw production is clearly superior to that of Posey. But is that all we need to look at to conclude which player is more valuable? Don’t we need to include some measure of “replacement level” in this calculation? Isn’t that what WAR is all about? Wins Above Replacement?
How do I account for the fact that the day after our fantasy draft I can go out to the free agent listing and pick up an OF that would produce 61 R, 10 HR, 47 RBI, and 15 SB (478 points), or a Catcher that would produce 38 R, 9 HR, 45 RBI, and 7 SB (319 points)?
Clearly the replacement catcher is much less productive than the replacement level OF.
Using Points League Settings
You’ve been following me through the creation of a rankings file for an example league. We just finished converting projected statistics into point values for this league, so let’s take a look at comparing Braun to Alejandro De Aza (a hypothetical replacement level OF) and Posey to Christian Bethancourt (a hypothetical replacement level catcher).
| Player | Projected Points |
|---|---|
| Ryan Braun | 752 |
| Alejandro De Aza | 478 |
| Buster Posey | 681 |
| Christian Bethancourt | 319 |
Braun is projected for 274 points over the replacement level outfielder and Posey is projected for 362 points more than the replacement level catcher!
That means Posey is roughly 88 points more valuable than Braun, despite having lower overall projected points.
If you’re having a hard time digesting that, think of it this way. Let’s assume Braun and Posey represent second round draft picks (just go with it, don’t argue) and De Aza and Bethancourt will be last round draft picks (replacement level).
The team that takes Braun in the second round and Bethancourt in the last round would be projected for 1,071 points. The team that takes Posey in the second round and De Aza in the last round would be projected for 1,159 points. Again, that’s 88 more points than the Braun/Bethancourt combination!
This is why considering replacement level matters.
Positional Scarcity Adjustments
You have probably come across suggestions or you might have even thought to yourself that you should “bump” a player up your rankings because he plays a weak position. But is this really appropriate? How much do you bump him up?
Another great benefit of incorporating replacement level into your rankings is that it makes your positional scarcity adjustments for you!
You just saw how we proved Posey’s 681 points as a catcher are more valuable than Braun’s 752 from the outfield. Rather than arbitrarily “bumping” Posey in the rankings, we can figure out exactly where he should be ranked by calculating his “Points Above Replacement”.
Let’s look at the top 15 projected hitters in my example points league.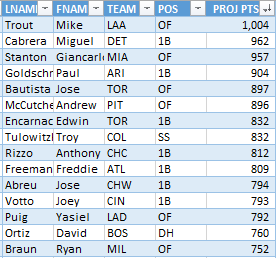
Not a catcher to be found. But if we presume this league has 24 starting catchers (you need to read this if you play in a two-catcher league), things change significantly when we calculate points above replacement.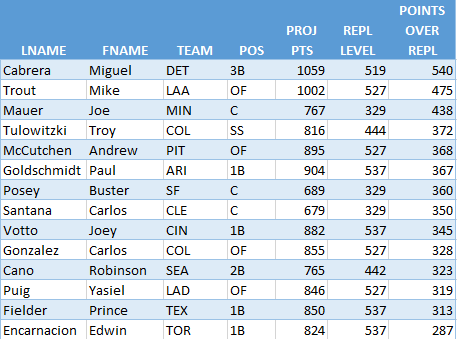
Three catchers rocket into the top 10 while OF and 1B are devalued some. This movement that takes place after you calculate Points Over Replacement Level IS THE POSITIONAL SCARCITY ADJUSTMENT. Players move exactly the proper amount. No guesswork.
EXCEL FUNCTIONS AND FORMULAS IN THIS POST
Nothing really new here. We’ll just be using things we’ve already used in earlier parts of the series. We will use another VLOOKUP formula, create a table, and use structured references to build some formulas.
STEP-BY-STEP INSTRUCTIONS
| Step | Description |
|---|---|
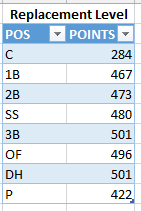
| 1. | On the “Scoring Settings” sheet, begin to fill out the information you see in columns G and H below.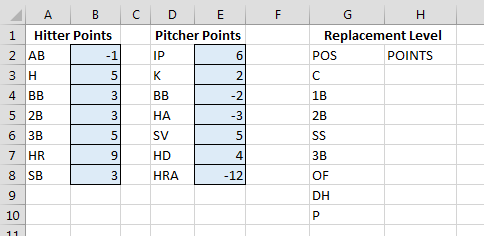 |
| 2. | Click and drag with your mouse to select the area of the table you have started (ignore the “Replacement Level” heading).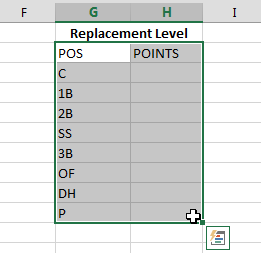 On the “Home” tab of the Ribbon, select the “Format as Table” drop down and choose a color scheme. On the “Home” tab of the Ribbon, select the “Format as Table” drop down and choose a color scheme.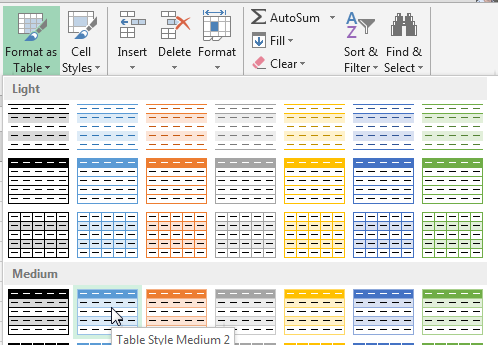 Make sure to specify that your table has headers (check the box). And hit OK. Make sure to specify that your table has headers (check the box). And hit OK.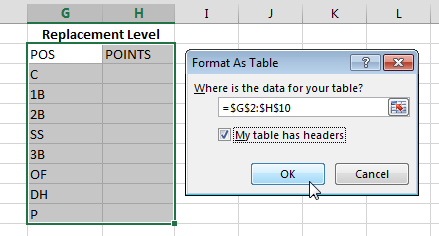 |
| 3. | Just like with all our other tables, we should give this a name. On the “Formulas” tab of the Ribbon, click on “Name Manager”. When Name Manager appears, choose to Filter the list by “Table Names”. When Name Manager appears, choose to Filter the list by “Table Names”.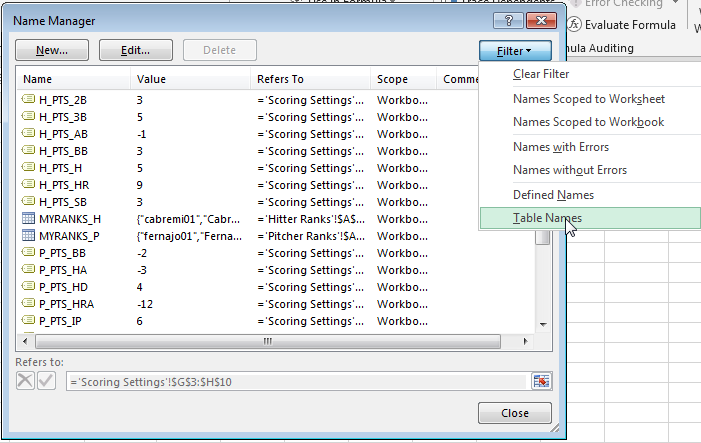 Locate the only unnamed table (mine is “Table4” in the example below). Click on the table in the list and then hit the “Edit…” button. Locate the only unnamed table (mine is “Table4” in the example below). Click on the table in the list and then hit the “Edit…” button.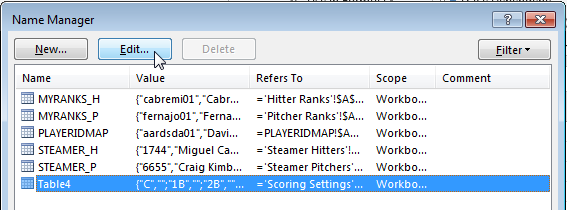 Change the name of this to “REPLACEMENT_LEVEL” and hit “OK” to save the name. Then hit “Close” to exit the “Name Manager”. Change the name of this to “REPLACEMENT_LEVEL” and hit “OK” to save the name. Then hit “Close” to exit the “Name Manager”.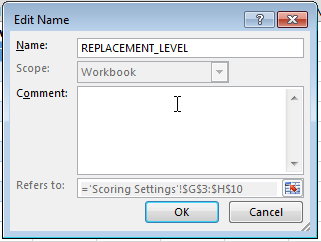 |
| 4. | Return to the “Hitter Ranks” tab. 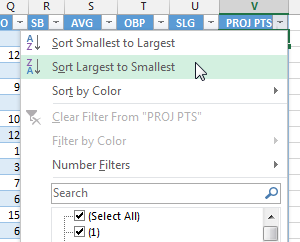 Now click on the downward pointing arrow on the “POS” column. Click/toggle the “Select All” box until all selections are cleared (none are checked). Then click to select only the “C” position. Click “OK” to accept this filter. Now click on the downward pointing arrow on the “POS” column. Click/toggle the “Select All” box until all selections are cleared (none are checked). Then click to select only the “C” position. Click “OK” to accept this filter.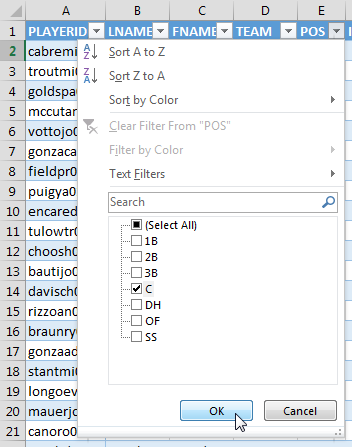 |
| 5. | Consider your league size and roster rules and developan approximation of how many catchers will likely be drafted.
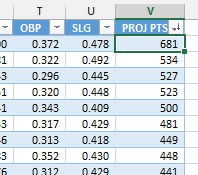
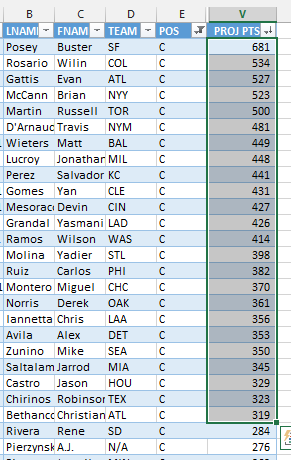
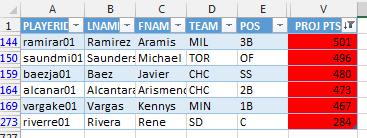
For example, in a 12-team league in which each team starts two catchers, there likely won’t be any catchers starting at the DH/UTIL spot. This means that 24 catchers will be drafted. To determine who the replacement level catcher will be, click once on the “PROJ PTS” value of the first catcher (Posey in my example). Then click and drag to select more players (you can see an image of this below, make sure you are highlighting only one column). As you continue to select more players, watch the “Count:” field on the Excel status bar. |
| 6. | Stop highlighting when the count of catchers reaches the number you expectto be drafted (e.g. 24).
The replacement level player is the very next player that falls outside of the top 24.In the screenshot below you can see that the first catcher not to be drafted will be Rene Rivera. His projected points are 284. |
| 7. | Return to the “Scoring Settings” sheet. 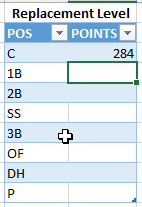 |
| 8. | Repeat steps 4 – 7 for eachposition.
If your league has Corner Infield and Middle Infield roster spots, determining replacement level for the infield positions involves some additional work. The easiest method (it’s a little imprecise) would be to assume 18 1B will be drafted and 18 3B will be drafted (12 1B to play the 1B slot, 6 1B to play CI, 12 3B to play 3B slot, and 6 3B to play CI). Then click and drag so you can see the count of the 36 top combined 1B and 3B. Then manually count to verify there are at least 12 1B and 12 3B (to fill the actual 1B and 3B positions).
As long as you have at least 12 1B and 12 3B, nothing else is necessary. If you don’t have at least 12 3B, take one 1B out of your group and add in the next best 3B. For example, when I ran through my hypothetical league I found that the top 36 corner infielders were made up of 22 1B and 14 3B. The very next first basemen and the very next third basemen outside of that top 36 are your replacement level players. You must follow a similar process to account for the UTIL/DH spot in your roster. This will push replacement level even further down the list of players. The UTIL/DH slot is likely going to end up changing who the last 1B and OF are. Instead of drafting the top 22 1B (in my example), my league will also likely draft even more 1B to put at the UTIL/DH spot. NOTE: Explaining how to identify replacement level in writing is very difficult. It’s probably even harder for you to understand my scattered thoughts. That’s why I created this video to show a practical approach you can use. The video is using “Standings Gain Points” instead of “Projected Points”, but the exact same approach can be followed. If you do follow the approach in the video you’ll have a very easy to understand color-coded result letting you know exactly who the replacement level players are. In the end, you must verify that your projected pool of draftable players satisfies your league’s roster requirements. If you are in a 12-team league with traditional roster requirements (where each team drafts 14 hitters), select the top 168 players and verify that at least 24 C, 36 CI, 36 MI, and 60 OF are included. Provided these limits are met, the replacement level points for each position is very next 1B, 2B, SS, 3B, or OF that fall outside of your pool of draftable players. REPLACEMENT LEVEL FOR THE UTIL SPOT: Your UTIL slot is likely to be filled by a variety of positions (1B, 2B, OF, etc.). Because it can be filled by a player of any position, I believe you should make the replacement level points for DH/UTIL equal to the position with the highest replacement level (this is covered in the video too). |
| 9. | Follow steps 4-7 to determine replacement level for pitchers. This should be much simpler because even if your league uses specific “SP” and “RP” spots, you don’t need to determine replacement level for these differently unless your league has a very unique configuration that forces you into drafting relief pitchers to fill spots.
After you have identified all your replacement level players, make sure you’ve filled out the entire REPLACEMENT_LEVEL table. |
| 10. | Let’s focus just on hitters for a few steps.
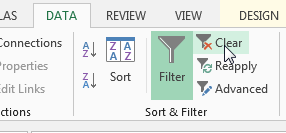
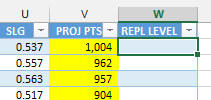
We now need to adjust each player’s projected points to reflect their points above replacement level (like we did above in our Braun vs. Posey example). Go to your “HITTER RANKS” tab. Make sure you have cleared any position filters. To do this, click once on a piece of data in the “HITTER RANKS” tab. Then go to the “Data” tab and click the “Clear” button. Now add a new column header next to your “PROJ PTS” column. This is where we will pull in the Replacement Level points for each player. Column W is the first unused column in my example file. So click in cell W1, type “REPL LEVEL”, and hit Enter. |
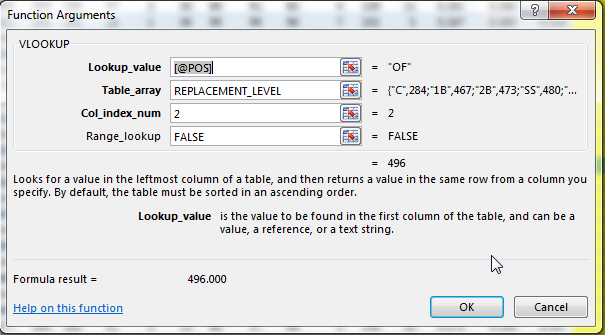
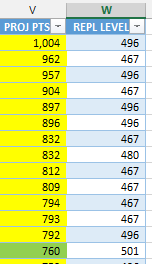
| 11. | To populate this “REPL LEVEL” columnwe want Excel to look at each player’sposition, go find thatposition in the replacement level table we just set up on the “Scoring Settings” tab, and bring back the replacement level point value for that position.
We can do this using a VLOOKUP formula. Recall that the VLOOKUP formula is used to search in another table for a specific value (look in the replacement level information and find a specific position). The formula to use for the VLOOKUP in cell W2 is:
You might be wondering why I typed a “2” in for the Col_index_num. The reason is because the REPLACEMENT_LEVEL table does not start in Column A, like all our other tables have to this point. The formula “COLUMN(REPLACEMENT_LEVEL[POINTS])” returns an 8 because it’s in column H of my “Scoring Settings” tab. Review the output of the formula. An easy way to see if everything is working properly is to look for a catcher in the list and verify the point value is consistent with your results from step 7 above. |
| 12. | Now let’s add a column to calculate points above replacement level for each player. My first empty column in my example file is column “X”. So in cell X1, I’ll type “POINTS OVER REPL” as the column header and hit Enter.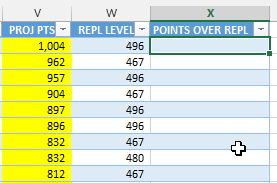 The formula here will simply be: The formula here will simply be:
Type the equals sign and then use your mouse to click on the “PROJ PTS” and “REPL LEVEL” columns as needed while building the formula. |
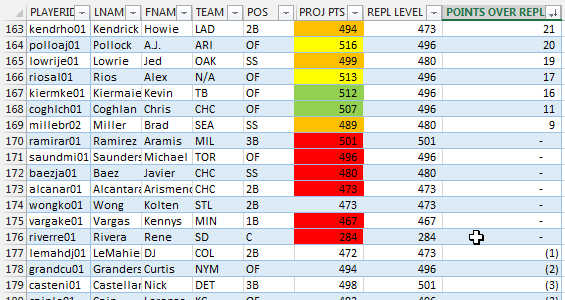
| 13. | As we looked at in the introduction to this part, it’s possible that player rankings (especially for catchers) can shift after you take replacement level into account. Sort the “POINTS OVER REPL” column by clicking on the downward pointing triangle over the column. Then select “Sort Largest to Smallest”.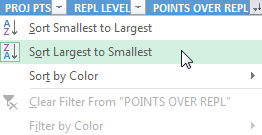 |
| 14. | The POINTS OVERREPL column becomes very important if we are to eventually calculate dollar values for players. It’s important that this column show 0 for the replacement level players in your league.
YOU NEED TO CHECK THIS. Recall that my example spreadsheet is being built for a 12-team league where each team drafts 14 hitters. That would be 168 hitters drafted in total. You can see in my example below that as I approach the 168th player and move into the replacement level players the “POINTS OVER REPL” approach zero. You should see this same thing! As you approach the last few drafted players the “POINTS OVER REPL” should approach zero. If you don’t see this type of result, you need to reevaluate replacement level and make adjustments to the “REPLACEMENT LEVEL” table on the “Scoring Settings” tab. |
| 15. | Repeat steps 10 – 14 for pitchers.In a 12-team league that rosters 9 pitchers, 108 starting pitcherswill be drafted, leaving the 109th pitcher as “replacement level”.
Adjust this for your own league’s settings.Even if your league has different spots for Starting Pitchers and Relief Pitchers, I do not recommend determining replacement level for RP and SP. Make sure you perform the same check of your pitchers. As you approach replacement level, the “POINTS OVER REPL” should move towards 0. As you move below replacement level, you should see the points go negative. |
| 16. | Save your file. You have now completed your points league hitter and pitcher rankings! |
WRAP UP
We have calculated the points over replacement level for each player. You no longer have to make arbitrary decisions because you’re trying to account for “positional scarcity”. The points over replacement level factors this in. It’s not as simply as comparing the points over replacement level for a catcher and comparing them to an outfielder.
CONVERSION TO DOLLAR VALUES
I have taken the six-part series you just completed and adapted into a nine-part book that also shows you how to convert points over replacement into dollar values and how to calculate in-draft inflation. Click here if you’re interested in reading more about the conversion to dollar values.
DO YOU HAVE ANY QUESTIONS?
If you have questions, it would be great if you can ask them in the comments below so others can benefit from the discussion.
If you’d like to know when I put out the next post in the series or similar posts in the future, click below to follow me on Twitter.


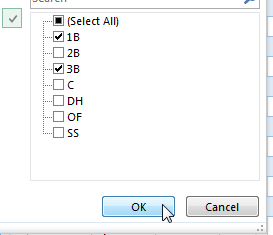 If you want to be more precise, set your filters to show both 1B and 3B at the same time.
Do you have any questions about Part 6? Please leave them here and I’ll do my best to answer them.
How do you handle bench spots for determining replacement level? In that case, it seems that the method you describe here could undervalue a guy like Wilin Rosario (high points/PA, low PA).
Hi Mark, this is an interesting question. Let me first address the general question about how I handle bench spots. I believe your determination of replacement level should take bench players into account. So if your league would draft 168 hitters, 108 pitchers, and then has 48 more bench spots, replacement level is not just hitter 168 and pitcher 108. I would estimate how many of those 48 bench players will be hitters and how many would be pitchers. So maybe I assume they’ll break down 24 and 24. So I would try to determine my top 192 hitters and top 132 pitchers.
Admittedly, this ranking approach I’m outlining is only focused on total points a player will earn for the entire season. So if you are in a league that allows daily lineup changes and you intend to run a platoon with some players (use two roster spots on your team and play matchups against opposing pitchers), the players in that platoon are not going to be valued highly if they don’t play every day for their MLB teams. But the act of combining them and platooning might allow you to create a valuable player.
Rosario might be a bad example because if you believe Steamer and also depending on your scoring format, he might very well rank as one of the top 5 catchers so he would likely be a starter.
But your point is well taken. I see an argument for some kind of value in players that don’t play all the time but have high per game points, but if your league has games played limits and limits roster moves, that value gets eroded some. We can’t purely evaluate players on a per game basis either. The main priority still needs to be on total points for the season.
Have you seen other points ranking systems that take per game scoring into account? If so, I’d like to read up on them and see how they’re doing it.
One more thought I have on this is that I think player values are in flux all season long. Here’s an example. Let’s assume Kris Bryant stays in the minors until June 1st (not saying that’s going to happen, but for the sake of example). And then let’s assume we project him for 300 points over the second half of the season. And then assume that really good players are projected for 500-700 for the season.
If we value Kris Bryant today he would not come out very well in the rankings because he’s only projected for 300 points FOR THE SEASON. But if really good players are only projected for 500-700 for the season, that means they’ll only score 250-350 over half the season. Suddenly Kris Bryant becomes one of the best players in the league once he’s called up. His value today is very little. As we move towards June 1st his value begins to sky rocket.
I’m rambling. I don’t have a perfect answer. I’d be careful not to put too much stock into per game point projections, but I see some merit to doing something.
I definitely agree about value being in flux. Kris Bryant isn’t earning anybody points crushing dingers in Iowa, but he could be an instant impact player once he gets to Wrigley.
Chad Young’s ottoneu values over at RotoGraphs use a replacement level in terms of points/PA, with the final PAR calculated as (points/PA – replacement)*PA. It would seem more appropriate to use points/G over points/PA, but unfortunately the mass Steamer download doesn’t include a column for G on the hitter side.
Piggybacking off your Bryant example, if I use the Fan projections (which do include G in the download) and ottoneu scoring, he comes in as the #16 3B for 2015 using raw point totals. The Fans say he’s the top 3B for points/G, but his 114 G projection drops him to #7 by (points/G – replacement)*G.
I don’t have a perfect answer either. My gut feeling is that the deeper the bench, and the later the draft round, the more the points/G effect matters. But I’m not sure how much more.
Thanks, Mark. I’ll check out Chad’s rankings and see what I can draw from them.
Tanner, it seems that steps 4-9 would need to be repeated whenever projections are revised. That’s a fair amount of data-entry work (and an inducement not to update projections). Is there no way to automate that?
Hi Scott, you ask a great question. It is true that it would be imperative to reperform steps 4-9 with each updated set of projections you bring in. That is one reason why I revised that system slightly to the one I use in in the video linked above. I found that it was much faster and more reliable once I got the hang of it.
But I agree whole-heartedly that I wish there was a way to automate this. I have started working on a way to automate it but it GREATLY complicates things and I ended up concluding that it’s not something I can describe well enough to put on the site. The method I am working on right now ends up adding 17 more columns to the spreadsheet! Finding a replacement level player at a given position is not that challenging, it’s the corner infielders, middle infielders, and UTIL slots that greatly complicate everything.
I’m trying to replace outdated Steamer rankings with more recent one’s. When I try to repeat earlier steps, it makes me reinput every single formula all over again. Is there an easier way to do this? Thanks.
For example, I want to replace the steamer pitcher rankings from 2.15 with the one’s from 2.17. I DL the 2.17 data, format it in the proper way – player ID ahead of name, in a table, etc. I move the sheet into my main sheet with all of my formulas, name it Steamer_P (just like the one it was replacing) and delete the old sheet. When I look in my Pitcher Ranks however all of the columns are either 0’s or #REF. When I re-type in each formula, it notices the new sheet but there has to be a quicker way to update data, correct?
Hi Alex, this is a really good question because I do try to design things so they’re easily reusable (from one season to the next or so you can just get updated projections and “drop them in”). Instead of deleting the current projection tabs, I would leave them in place but just delete out the projection data (leave the column headers). Then paste in the new projections (so you’re not moving the whole tab, you’re just copying and pasting the stats, that way the formulas looking to this table will remain in tact).
I have a very similar example written up for this here. It’s specifically part of a Standings Gain Points series, but the same concepts apply.
Hi Tanner,
I was hoping you could help me out with my next step in a fantasy points league. I play in a league with 1350IP max. I have my projected totals for each player based off from my league’s scoring system. I have sorted out the 12C, 12 1B, 12 2B, 12 3B, 12 SS, 36 OF, and 24 UTIL, along with 108 SP. I created the Margin points based on subtracting the lowest point total batter (Yan Gomes 279 points in my league) from the other batters. I did the same for pitchers subtracting the 108th pitchers total from the other pitchers points, getting my margin points for all players. Then I added the margin points for the league and divided the total by 2844, to figure out the $ amount for each margin point. Then I multiplied the margin point of each player by that number to get their auction $ amount (all players in the leagued added up to $3120 just like it should).
Here is where I’m stuck. In my league Clayton Kershaw is projected for 792 points over 220IP my $value on him is $46. Craig Kimbrel is projected for 480 points across 65IP and my $ value is $19. Kimbrel is way more valuable because he gets me more points per IP, but my $ value on Kimbrel is way less.
How can I take IP into my calculations to get better $value for pitchers?
I just feel like my $ values are off.
Is my best plan to spend money on my closers/holders and then the best bats. Spend $1 on starting pitchers and just stream based on match ups?
Sorry for the long post!
Love the site
Hi Andrew. This is a really thought provoking question. I wish I had a bigger mathematics background to draw upon for this. I don’t have a definitive answer, but I’ll “think out loud” here for a bit and see if we can move closer toward the best solution to this problem.
It seems like you still have 9 pitcher slots per team. And while I see the reasoning behind wanting to increase Kimbrel’s value, what’s holding me back is that even if you had 9 elite Craig Kimbrel’s, you’d still only have about 540 innings pitched (60IP * 9).
To get to 1,350 over 9 pitchers you’re talking about an average of 150 IP per slot. I’m guessing you have the option to stream, so that helps. But the fact remains that you need to average 150 IP for each of those 9 slots. And if you fill three of those spots with RP, then you’re talking 195 IP for the remaining 6 spots (1,350 – 180 = 1,170 / 6 = 195 IP).
So Kimbrel’s PTS / IP seem nice, but you really can’t weight them too heavily because then you’re making it much more difficult to fill the remaining IP.
This is a manual exercise, but if you give yourself a fixed budget, what mix of players can you create to build the pitching staff with the most projected points? Can you build a better team with three good relievers? Or can you build a better team with 9 average starters? Or with Kershaw and some other mixture?
Thanks for the response! I’ll have to fiddle with it.
My plan is to stream pitchers throughout the year.
I have another question related to 5×5 roto leagues that I’m having a tough time finding any background on.
Is it a plausible strategy in a 12 team 5×5 league to not use SP throughout the year, stocking up on hitters, and closers during the draft. I would bottom out in W and K, but lead in WHIP,ERA,Saves and the hitting categories.
When somebody 1st mentioned this strategy to me I thought it can’t work. Then I started thinking that it really could work with the elite closers and in a league without an innings pitched minimum.
Any thoughts?
I am vehemently against any kind of punting strategy in a roto league. What you’re describing has a reasonable chance of success in a H2H league because you’re only playing one other team each week. But you’re not just going to lose W and K to one team, you’re going to lose 22 possible rotisserie points.
I don’t think you can guarantee that just by focusing in on RP that you will win WHIP, ERA, Saves, and especially not hitting.
The way I like to think of things, and I’m guessing you might too if you’re reading this site, is that I will be better prepared and more knowledgeable about fantasy baseball than just about anyone else in my league. Maybe not everyone, but most of them. I am a bit of a nerd and I spend WAY more time than nearly everyone else thinking about these things, considering different strategies, and preparing for the season.
So if I really believe I’m one of the more skilled and best prepared managers in my league, why would I punt any category? If I think I can out-draft most teams and out-manage most teams, why would I give up that advantage?
I surely will not win every category, but I believe that by going for first place in all categories that I have a good shot at finishing in the top 3 or top 4 in all of them. And that gives me a much better chance at winning than knowing I’m going to get last in two of the categories before the season even starts.
Thanks Tanner, great thoughts as always
You’re welcome! Sorry if I got a little heated. Can you tell I don’t like punting?!?!?
No problem at all! It’s nice to find people that are passionate about fantasy baseball.
For people in points leagues, how do you project blown saves? None of the projection systems I use project this category and yet it is used in my points league. I was thinking of just using a blanket number. For example, say every pitcher’s blown saves with equal 10 percent of their projected save total.
Obviously that is very imprecise but I can’t think of a better way and don’t want closers to be overvalued if they aren’t being penalized for blown saves.
Hi Carl,
Wow, interesting thought. I have never bothered to project blown saves, mostly because I don’t think it can be done reliably AND because I don’t think there’s much of a spread there (the best closers are going to blow three or four and the worst seven or eight?).
But the point that you don’t want to overvalue relievers because of it is worth thinking about. I think your simple solution of giving everyone 10 percent is a great solution to the problem.
Playing devil’s advocate, it still may not matter much. Closers are so unusual. We can sit here and try to value them properly all day. But when push comes to shove, in a draft, their values don’t matter. When and where to draft a reliever is all game theory and just reacting to when everyone else will do it.
With that said, I’m a stickler for trying to make things as accurate as possible. So I do like your simple solution to the problem.
Thanks,
Tanner