I can’t believe it took me so long to think of this! In this post I’ll share a new Excel template I created to help calculate your SGP factors (or SGP denominators).
One of the very first posts I wrote on this site was about “Calculating What it Takes to Win Your League”. I’ve then gone on to write many articles about standings gain points and even about an improvement in the process I found by reading Art McGee’s book “How to Value Players for Rotisserie Baseball” (It’s quite expensive at Amazon but Baseball HQ has had it on “Inventory Closeout” for quite a long time).
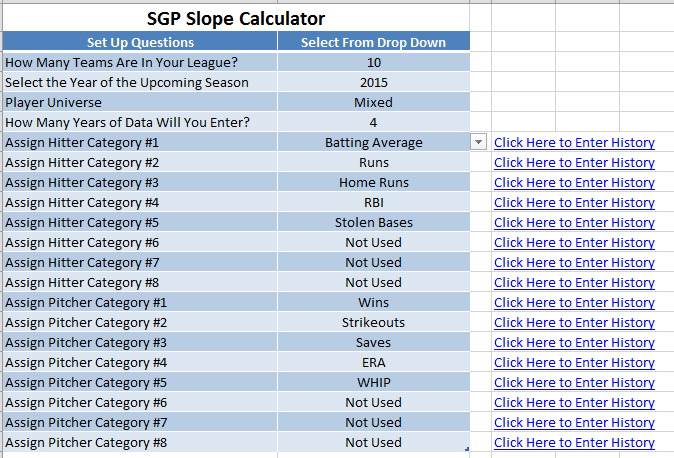
So after a few years of writing about SGP it finally dawned on me that, “I should create an Excel file that wraps all this together.” So that’s what I’ve tried to do. The “SGP Calculator” asks a few simple setup questions about your league, the amount of history you want to use, and then uses the SLOPE formula to calculate the standings gain points for each of your league’s scoring categories.
Here’s How the “SGP Calculator” Works
The first tab is aptly named “ANSWER THESE QUESTIONS FIRST”. Several of these are very important in determining how the slope calculations are made so don’t skip over this.
The Excel file can accommodate up to eight different hitting and pitching categories, up to 10 years of standings information, and up to 15 teams. Use the drop down menus on this tab to select your league’s setting.
The next tab in the spreadsheet is “SGP CALCULATIONS”. Let’s skip over that for now and circle back to it.
![]()
The yellow colored tabs are where you will enter your league history of the overall standings and the totals in each individual category. There are tabs for “Historical Final Standings” (where you’ll enter the total ending roto points for each team), “Hitter Stats”, and “Pitcher Stats”.

Each yellow tab displays the “Category Name” in the top left (see “Batting Average” example below). You can enter the history for that category in the table below. Because the spreadsheet has been set up to accommodate 15 teams and 10 years of history you may see several rows and columns with labels “DO NOT ENTER DATA”. Just ignore those rows and columns and only enter data for the years and number of teams you have selected.

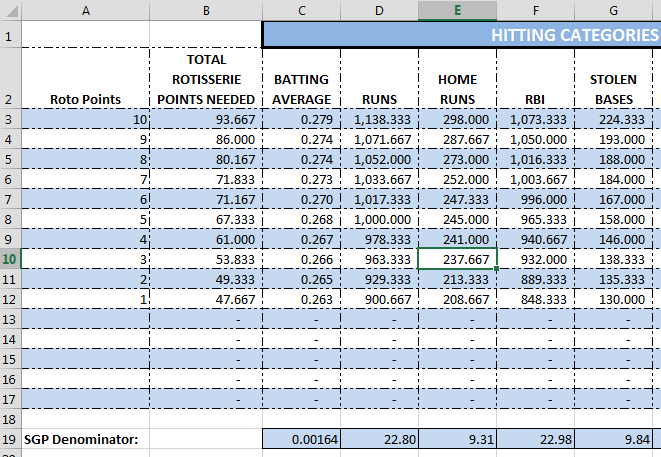
Now we can return to the “SGP CALCULATIONS” tab, the end result. It displays the average statistics for each scoring category and uses Excel’s SLOPE formula to calculate the SGP factor (denominator) for each category.

These are the same SGP factors you would then plug into your customized rankings.
Download the File
You can download the file using this link: SGP Slope Calculator Spreadsheet.xlsx
Or check it out at the Smart Fantasy Baseball Tools page with the Player ID Map (and hopefully some additional tools in the future).

Hey is there a way you can add BB/9 for pitching? And I suppose for a league that uses singles, doubles, and triples I can just use a counting stat category like HR to input those?
Hi Anthony, I just uploaded a new version that has the categories you mentioned. Thanks for the suggestions.
You the man Tanner, thanks a lot!
That’s awesome! You have combined to spreadsheets that use the same input into one easy spreadsheet. Now, I can see “what it takes to win” point-wise, plan my strategy to get there with stats category by category and have my SGP factors to plug into my rankings ALL IN ONE PLACE. Thank you!
Thanks, Kevin… Like I said, I can’t believe I didn’t think to do this sooner. The first version was so close. Just missing the SLOPE formulas.
Tanner, is this the same as the What It Takes to Win Calculator? It looks like it.
Nevermind, it has the same inputs but gives you SGP calculations.
Exactly. It’s the WITTW file with something I should have added a long time ago.
Tanner, any idea where to get historical standings for other stats? My 12 team league had been a standard 5×5 until this past offseason, when we decided to switch to OBP over AVG and QS over W. Your methods have been awesome in helping me, but now I’m finding SGP difficult without any past data… Thanks for all your help!
Hi, Chris. Thanks for following the site. You have indeed hit upon the biggest weakness in the SGP approach… it requires previous history and unfortunately I don’t know of a great resource in this department although I have hopes to figure this out some day in the future. I do have an example article on OBP here, but the league size and depth may not line up for you. But it’s a starting point.
Unfortunately, I have not seen any history on QS. If someone happens to read this and has league history for QS, please let me know. I’d love to get my hands on your league data.
Thanks for the reply! All the stuff on the site is great. The only options I think I have since I do have league history on most of my stats (including AVG) is maybe trying to correlate AVG to OBP and ERA/WHIP/Ks to QS. It’s rough, but it might be good enough for a year.
Otherwise, I don’t know that I’d call league history being required for SGP a weakness – it definitely makes things difficult but that’s why I’m switching to SGP. I’d used a z-score based method in the past, and I liked it for the rough idea of player worth, except for the fact that I had no idea how a player would actually help me win in my league. SGP’s biggest strength is that it isn’t a one-size-fits-all formula, in my opinion. Inherent in the method is a way to tailor to your specific situation. With a 5×5 using QS and OBP, SGP will be extremely helpful since there aren’t widely available player rankings or draft cheatsheets out there for that kind of format.
Thanks for your reply!
Hey Chris, My league switched from a 5×5 to a 6×6 about 5yrs ago. Changing Wins to QS, adding Holds and changing Avg to OBA and SLG. This definitely changed up actual player ranking from everyone’s perceived rankings because like you said above there are not many freely available player rankings/draftsheets for these type of leagues. I’m happy to give you access to my league history. I placed it on google drive (1st time to share a file on google drive so I hope you can access it).
https://drive.google.com/file/d/0BwpMBRCtL1BXTzZIekh0b0x2QWs/view?usp=sharing
Tanner, I sent you an email with the history attached.
Thanks Kevin! That’s awesome info – I really appreciate the crowdsourcing effort there. Since my league is 12 teams, I’m not exactly sure how to apply it, but if anything I can run with it and compare to my other values I have set. I’m curious to see how my stats turn out after a few years in this new format. I REALLY appreciate your advice on QS – I was already leaning towards spending heavy on big hitters and one or two “ace” pitchers, but that further confirms my idea (and your reasoning and experience makes perfect sense). That’s all super helpful stuff!
Hi Tanner, my league has used QS since 2010 and in another league since 2013. How can i get you that data?
Ooooh, thanks! I’ll e-mail you.
One piece of advice I would give you when switching to QS…You’re probability for getting a QS out of a pitcher you stream is much better than trying to get the W. I load up on hitters and grab 1 or 2 stud pitchers early in the draft knowing that my average to scrub pitchers I grab at the back end of the draft are actually place holders for streamers throughout the season. Just something to think about. I would recommend Razzball’s Stream-o-nator as a great tool for knowing who to stream. http://razzball.com/streamers/
One thing to keep in mind is that by streaming you will take a hit on your ERA & WHIP because you will be streaming the pitchers that are not owned and there is a reason why they are available. You have to play the matchups (MIA was a great team to stream against last year!). It is important to have strong middle relievers in your lineup on the days you are not streaming to help negate the hit on ERA & WHIP and also add to your strikeout totals. With streaming starters, my goal for the end of the year is to be in the middle of the standings in QS, ERA & WHIP but then be at the top in Ks, Saves and as many of the hitting categories as possible.
Tanner, great site and another great resource! Quick question about the SGP Calculator. What would you recommend doing with a league that has expanded or contracted over time? I’ve been in the league three years. We had 13 teams in 2012 and 2013, but only 12 teams in 2014. I’m not sure how to make this work in the calculator. What do you recommend?
Hi Saul,
I have a very similar situation. One of my leagues has fluctuated from 11 to 13 teams in certain seasons and I just use the same history. I tried to design the calculator so if you enter in 13 teams it will calculate the slope the same as if you enter in 12. It’s not going to distort just because one year you have 12 entries and one year 13 (but don’t type in a zero in the year with 12! just leave it blank!).
I don’t think you’ll see much of a difference in the slope factor from the 12-team to 13-team seasons.
Tanner
Hi Tanner….what a great program, I have been looking for something like this for years!
Cheers!
Hey Ben, thanks! Glad I can help. Let me know if there are any other tools that would make things easier.