Welcome to the first part of a series in which we’ll go step-by-step through the process of using Microsoft Excel to calculate your own rankings for a fantasy baseball points league (as opposed to rotisserie or head-to-head rotisserie).
Whether you’re in a standard points league at a major site like ESPN or a more advanced Ottoneu league at Fangraphs, this process will help you develop customized rankings for your league. These instructions can be used for a season-long points league or a weekly head-to-head points league.
If you’re looking for info on how to rank players for a roto league, look here.
In this first part of the series we’ll start a new Excel file and download projection information.
Why I Created This Series
Points leagues seem to be like fingerprints and snow flakes. Each one is a little different than the others. I’m a big believer that in order to be a strong fantasy player, you need to create your own rankings and dollar value calculations that are tailored specifically to the league(s) you play in.
I’ve also felt that nobody takes the time to explain exactly how to create your own rankings. If you look hard enough you might find an article that gives a quick bullet point list. Maybe something like:
- Download projections
- Multiply projections by your point system
- Adjust for replacement level
- You’re done!
I’m going to be a little more thorough than that.
In Part 1
In this first part of the series we’ll download hitter and pitcher projections, take a look at and download player ID information, and bring all of this information into one Excel file.
ABOUT THESE INSTRUCTIONS
- The projections used in this series are the Steamer 2015 preseason projections from Fangraphs. If you see projections that you disagree with or that appear unusual, it’s likely because I began writing this series in December 2014, still early in the off-season.
- For optimal results, you will want to be on Excel 2007 or higher. Some of the features used were not in existence in older versions.
- I use Excel 2013 for the screenshots included in the instructions. There may be some subtle differences between Excel 2007, 2010, and 2013.
- I can’t guarantee that all of formulas used in this series will work in Excel for Mac computers. I apologize for this. I don’t understand why Excel operates differently and has different features on different platforms.
Where To Get Projections
There are many solid projection systems available for download. Some very fine projections are available at membership sites like Baseball Prospectus or Baseball HQ.
But if you’re like me, when I started out on the adventure of calculating my own rankings, I wasn’t looking to pay for something I wasn’t sure I’d be able to translate into fantasy success. It’s great to have accurate projections, but how do you use them if you can’t take the next step to rank and value those projections?
For that reason, I’m partial to the Steamer projections.
They’re available in easy-to-use Excel downloads (specifically CSV) at Fangraphs. There are also daily rest-of-season updates, meaning on any day you can see the projections for the remainder of the season for any player. Steamer does a good job of projecting playing time (if a player gets hurt, they try to estimate the effect on playing time).
And they’re free.
Use Whatever Projection System You Prefer
I’ll be using Steamer in this example. But you can use the system of your choice. Just try to pick a system that uses some form of player ID system.
What is a Player ID?
Just like you and I are identified by Social Security Numbers or employee IDs (at work), most of your major fantasy or MLB websites use some form of an ID number that is unique to each player.
Using an ID is a more reliable way of identifying a player than a simple name. Two players can have the exact same name (think Chris Young and Alex Gonzalez) which could cause big problems when ranking players.
And players can go by different name variations (Mike and Michael, Jon and Jonathan, JP and J.P., AJ and A.J.) or even change their name (Mike to Giancarlo Stanton, Fausto Carmona to Roberto Hernandez).
Here’s a quick look at some player IDs for various systems:
| Player ID Source |
Mike Trout |
Clayton Kershaw |
Giancarlo Stanton |
| Baseball Reference |
troutmi01 |
kershcl01 |
stantmi03 |
| Fangraphs |
10155 |
2036 |
4949 |
| MLB |
545361 |
477132 |
519317 |
| CBS |
1739608 |
1221725 |
1630093 |
| ESPN |
30836 |
28963 |
30583 |
If you’re wondering how to determine someone’s player ID, visit their player page on a particular website. You can usually find the player ID in that web page’s URL. For example, here’s Mike Trout’s MLB.com player page:

In looking at that table above, you can see here that there is not one universal numbering system.
To alleviate this problem, I maintain a “Player ID Map” (click here to download in Excel). The Player ID Map lists out all “fantasy-relevant” players and their ID for each of the major systems (Fangraphs, Baseball Reference, Baseball Prospectus, Yahoo, ESPN, etc.).

I stumbled across the concept of the player map from Tim Blaker at Crunchtimebaseball.com and tailored it to meet my needs. This provided me with an excellent starting point. Tim maintains his own version and updates his more frequently than I do. I only maintain my own because I’ve wanted to add some new columns.
On this site I will typically work with the Baseball Reference ID. I like those IDs more than the others because I can look at an ID and usually determine who the player is (troutmi01 is Mike Trout). Most other sites use a straight ID number that has no inherent meaning (10155 or 545361).
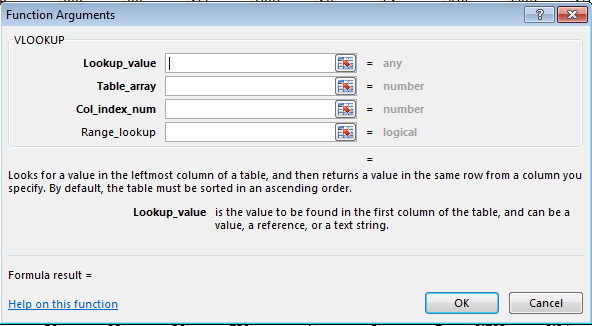
If you’re familiar with Excel and using VLOOKUPs, Player IDs are the item we’ll be matching upon to start pulling information around our Excel rankings file. If you have no idea what I just said, don’t worry. We’ll get there soon.
STEP-BY-STEP INSTRUCTIONS
Continue reading “How To Calculate Custom Rankings for a Points League: Part 1 – Download Projection Data and Player ID Map”
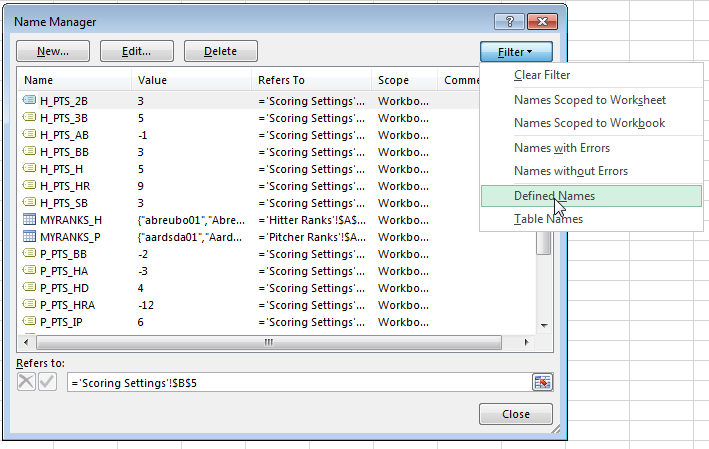
 To refresh your memory and to see the complete list of named cells, access the “Formulas” tab of the Ribbon and then click the “Name Manager” button.


