I recently got an e-mail from a reader of the site (thanks Brad!), asking an interesting question. He was working through creating his own standings gain points rankings and tailoring them for his custom league.
How do I bring Losses into the SGP calculation? If I do make losses a negative, how would I make the pitcher and hitter SGP numbers apples-to-apples?
You might realize that he actually has the correct answer, but it didn’t make sense at first because he wanted to keep hitter and pitcher SGP comparable.
Losses Are an Inverse Category
Losses, like ERA and WHIP, is a category where the goal is to have the lowest total. So the answer is to make the SGP factor a negative number. If you think about how we calculate SGP factors, we’re really trying to find the slope, or line of best fit, to our historical standings data.
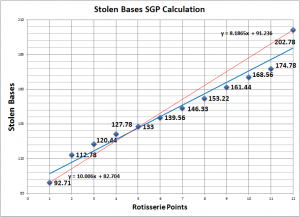
Traditional categories like Ws and Ks have a line with a positive slope (slanting up and to the right on your high school math class x- and y-axis). The higher the number of Ws on the x-axis, the more points you get in the standings on the y-axis.
The slope of a graph plotting out Losses would be downward sloping. The more Ls on the x-axis, the lower the standings points reflected on the y-axis.
So Brad had the right answer, but he was afraid that adding in another inverse pitching category was going to destroy his ability to compare hitter and pitcher SGPs.
The Real Reason We’re Here
I realize you didn’t come here for me to take you back to basic math class. The real question is, can you take a pitcher who is projected for 4 SGP and say he’s a better draft selection than a hitter projected for 3.8 SGP?
You Can’t!
Unfortunately, it’s not that simple. Hitter and pitcher standings gain points are not directly comparable.
Analogy time. You’re 33 years old. Have two young daughters. You’ve been saving for retirement ever since you started working, but now it’s time to get serious (<= that’s me).
You’re trying to make an investment decision between a stock that you project will earn 8% in the long run and a bond that you project will return 7% in the long run.
You go with the stock, right?
It would seem like that’s the correct choice. Even though these are two different types of investments, we’ve boiled their long-term performance down to a consistent measure in “rate of return”, right? So it’s a simple decision between 8% or 7%, isn’t it?
Not quite. A bond and a stock are two very different types of investments. The average return on stock investments over time is nearly 10%. The average bond is something like 5% or 6%. So you’re looking at an above average bond and a below average stock.
And arguably a bigger problem in comparing a bond to a stock is that you invest in these vehicles for very different reasons. It’s important to diversify an investment portfolio. Of course everyone would pour all their money into stocks, and their 10% return, if it were just that simple.
Diversification
A proper investing strategy diversifies risk and allocates your investing resources into different buckets. Maybe it’s 60% stocks, 30% bonds, and 10% cash.
That’s exactly the strategy employed in valuing fantasy baseball players.
You’ve seen me mention the 70%-30% split, right? That’s what we’re doing. We’re saying that we want to allocate 70% of our resources to hitting investments and 30% of our dollars into pitching investments.
There are many arguments about why the split is necessary and what the ideal split is. I am not going to go down that road too far, but some of the reasons are:
- We draft 14 hitters and only 9 pitchers (in a standard league, at least)
- We can better predict hitter performance
- Pitchers get severely injured more frequently, making investments in pitchers more dangerous
- And you can see that hitters outperform pitchers in the long run
How Do We Make Hitters and Pitchers Comparable?
So you can’t just take that pitcher projected for 4 SGP and decide he’s better than the hitter projected for 3.8. But we need some method of deciding how to compare hitters and pitchers.
This is where converting SGPs into dollar values becomes very important.
Dollar values are not just for auction leagues.
Converting projected stat lines for every player into a dollar value allows you to make direct comparisons between hitters and pitchers because it takes the 70-30 split into account.
Taking a pitcher SGP and comparing it directly to a hitter SGP is inherently putting you at a disadvantage because you’re more or less using a 50-50 split.
How Do You Calculate Dollar Values?
At a high level, here’s how:
- Determine the league spending budget for your league (number of teams multiplied by each team’s individual budget).
- Determine your desired split (65-35, 67-33, 70-30, etc.) and divide the league spending budget into a hitting pool of money and a pitching pool of money.
- Determine the total number of hitter SGPs over replacement level available
- Determine the total number of pitcher SGPs over replacement level available
- Determine the number of hitters to be drafted
- Determine the number of pitchers to be drafted
- Set aside $1 from the league spending budget for each hitter and pitcher that will be drafted (e.g. that might be $168 set aside for hitters and $108 for pitchers)
- Calculate the remaining hitting budget and the remaining pitching budget
- Calculate the dollar value of each hitter SGP and each pitcher SGP (e.g. remaining hitting budget / total number of available hitter SGPs over replacement level)
- Calculate each player’s dollar value as [$1 + (the player’s SGP over replacement * value of one hitter/pitcher SGP)]
That’s a lot of things for you to determine. And again, that’s why I started this site and why I wrote “Using SGP to Rank and Value Fantasy Baseball Players”. That bulleted list is about the best description I could ever find on the topic and I needed more explanation.
Along those lines, I somehow managed to turn that bulleted list above into four chapters and 70 more pages. So I think there were some details left out…
Just like I do in the free “Create Your Own Rankings Using Standings Gain Points” series posted on this site, I have detailed step-by-step instructions, screenshots, and example files to download in the Amazon Kindle edition of “Using Standings Gain Points to Rank and Value Fantasy Baseball Players“.
Once You Have Dollar Values…
Every decision you make becomes clearer. Whom to draft? Is this pitcher better than that hitter? Is this 2B more valuable than that OF? Which free agent to pick up? Is this trade beneficial to me? Should I keep this player or that player?
All of those answers are at your finger tips.
If you’re looking for a challenge this off season and want that kind of clarity in your decision making, converting projections into dollar values is your ticket. If you want to see a little more about what’s included in the book, click here.
One Last Thought
If you have a “how to” type question you’d like answered, please e-mail me at smartfantasybaseball at gmail dot com. I can’t guarantee I’ll have the answer, but I’ll try.
Stay smart.

