Who is the replacement level shortstop in a 12-team league that starts one shortstop and one middle infield position?
We know there will be at least 12 shortstops drafted in this scenario. But will there be 15, 16, 17, 18, or more drafted? And where does that put the replacement level shortstop at?
This concept of replacement level has always been a little bit of a problem for me. In my original series about ranking players, I mentioned that in this 12-team scenario, that we would have 36 combined 2B and SS drafted, and to simplify things we could assume that would be 18 second basemen and 18 shorststops.
But that’s not a precise enough answer.
If we’re trying to squeeze every drop of value from our drafts, we should determine precisely who the replacement level player is at each position. After all, replacement level is a huge driver in the calculation of a player’s value.
So we need to get it right.
What You Can Expect
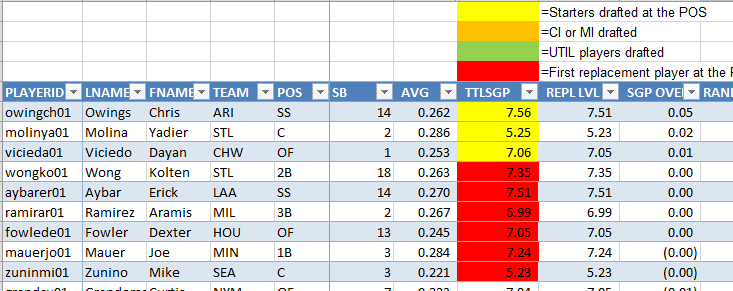
I’m going to show you a system I’ve started using that will help you identify:
- The starters at each position (e.g. top 12 1B, top 60 OF, etc.)
- The corner and middle infielders (the next 12 best 1B/3B and 2B/SS)
- The 12 utility players (the next 12 best players at any position)
- The replacement level player at each position
The system is very easy to do. I was forced to come up with it out of necessity when I was working on my recent analysis of the past five years of draft results. For that post I had to calculate projected and actual dollar values for each of the last five seasons. So I needed a fool-proof method for determining replacement level 10 times in a short period of time and I also wanted to be able to come back to each set of data and easily be able to tell what group each player fell into. Thus the color coding.

Excel Features You Should Know
There are three pretty neat features of Excel that I used during this process that you may not be familiar with, and they might be able to save you a lot of time:
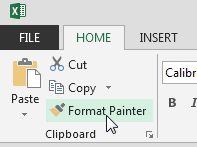
Format Painter and Double-Clicking Format Painter

If you aren’t familiar with the Format Painter at all, you’re going to get two tips here. Format Painter will copy all of the formatting from your active cell and paste it into one cell of your choice.
To use it, put select the cell you want to copy the formatting from. Click Format Painter. Then click the cell you want to format (paste the formatting to).
The thing many people don’t realize is that you can double-click on Format Painter. When you do this, it “locks” the formatting and you can then click on MANY different cells. Just keep clicking and it will continue to paste the formatting. When you’re done formatting, just hit the ESC key to exit.
We’re going to use this to easily copy the shading to a bunch of cells without having to shade cells one at a time and without having to go back to the paint can icon for 168 different players.
Filtering By a Color

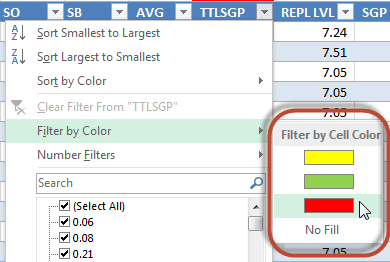
I recently learned about this one myself. You can filter and sort data by color. When you have the filtering bars active (or if you’re using Tables, like I commonly suggest), clicking on the drop down arrows will give you the ability to filter and sort data.
One of the options in that screen is to “Filter by Color”.
This is very helpful for this example. At the end, when we’ve placed all our players into groups, we want to get all the Replacement Level players together so we can easily transfer their Standings Gain Points to our Replacement_Level table. We can easily do this by filtering the data to see all the “red” players.
I can give one more practical example of when this can come in handy. As I learn of injuries to players during the preseason or if I’m trying to track players that will start the season on the DL (maybe pitchers recovering from Tommy John that won’t be back until mid-season), I will shade these players red so I don’t draft them. This would be a very easy way to find those injured players in your draft spreadsheet.
Or maybe you want to color code all your “sleepers”. This would be an easy way to find that list during the draft.
Using Multiple Windows to View Different Tabs in the Same Spreadsheet
Another trick I recently learned (that’s the neat thing about Excel, even if you’ve spent the last 10 years working in it, there’s still more to learn).
 You can take an Excel file and open it in a second window, allowing you to look at two separate tabs at the same time. This works really well if you have dual monitors. Put one window on monitor A and put a second window on monitor B. I use this for transferring the replacement level information from my hitter ranks tab to my replacement level information table.
This can also be helpful during a draft if you want to have one window for logging pitchers and one for logging the hitters being drafted.
How To Do It
Thanks for Reading
If you have questions about the video or are simply looking for advice on how to do something fantasy-baseball-related in Excel, please let me know in the comments.
If you would like to know when more “how to” Excel posts come out, be sure to register as a SFBB Insider or follow me on Twitter.
Do you have a link to your “new” settings page with the SGP items loaded in?
Hi Jonathan. I have not written about this, but I like the idea. I may try to write about this in the next few weeks and get it documented on the site. I do have something similar in concept in the recent “Points League” series I started. The idea would be to create named cells storing all of the different SGP categories/denominators. You can read about that example here.
I just followed your tutorial but have a question about how to update my dollar values. How do I adjust values using the new replacement level?
Hi Jonathan, did you follow the approach I outline in “Using Standings Gain Points to Rank and Value Fantasy Baseball Players” to originally calculate your values? If you follow that approach then everything is formula-driven, so as soon as you change who the replacement level players are then the values should automatically adjust accordingly.