If an average hitter is bumped from the sixth spot in the batting order to the two-hole, how much of a bump in performance can we expect?
I’ve written a little about this before. Mostly just suggesting that this is something to keep in mind when you’re looking for hidden value. And I always had in the back of my mind that when I finally got around to downloading all the retrosheet game logs for each season AND learned SQL that I could figure out exactly how much of a benefit this would represent.
Then my five-year old daughter starts playing soccer and is bringing homework back from kindergarten, my sister and twin sister-in-laws all decide to get married in a two-year period, work gets in the way… and before I know it those plans of teaching myself how to process game logs are out the window!
Thankfully though, I stumbled upon the league splits page for the 2014 season at Baseball-Reference.com. And it has the batting order splits already calculated for me!
Charts and Table Data
I have taken the 2014 data from Baseball Reference tweaked it some. You will first see a series of charts depicting the batting order splits for 2014. Then after the charts you will see tables showing the MLB, AL-only, and NL-only data.
I’ve added calculations for Plate Appearances per Game, Runs per Plate Appearance, and RBI per Plate Appearance.
These measures are all important inputs when I’m projecting a player’s performance (side note, if you are interested in projecting stats here is the approach I use). Knowing (or estimating) where a player will bat in the order affects the number of times they’ll come to the plate during the season. That spot in the order also affects their run scoring and run driving productivity. You’re more likely to score batting in front of the 3- and 4-hitter than you are batting seventh.
Plate Appearances
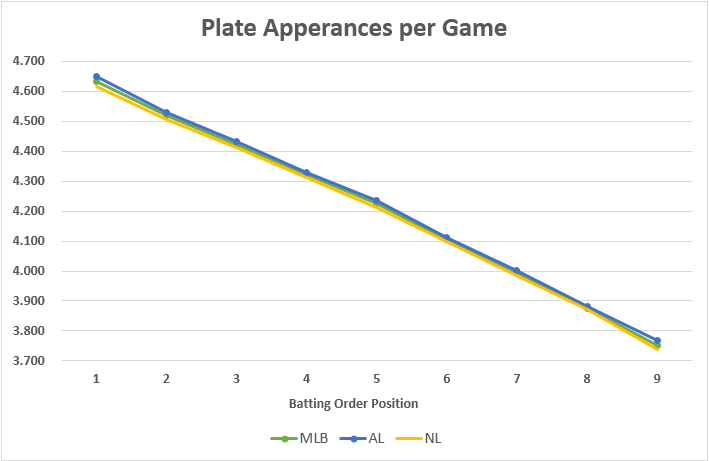
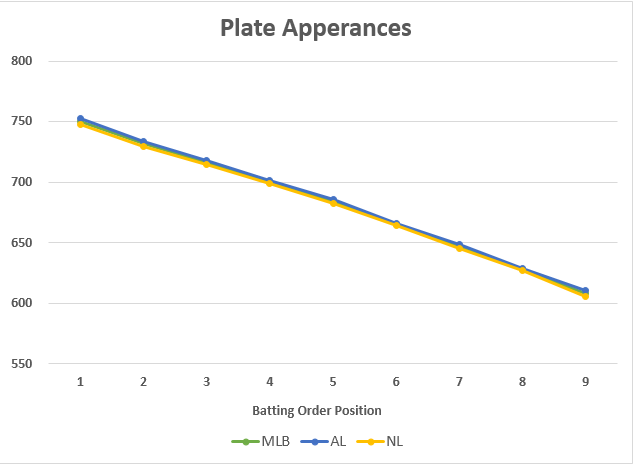
The graph below shows that for every spot a player drops in the lineup, they can expect to see about 0.10 or 0.11 fewer plate appearances per game. Over the course of a 162 game season that is about 16 plate appearances. Fall from second in the order to 7th, you’re looking at 80 less plate appearances.
Notice that there’s really not much of a difference between the AL and NL in terms of plate appearances for any spot in the lineup.
Runs
When analyzing runs scored there are two factors at play:
- You are more likely to score a run the higher you bat in the order. This is because the best hitters generally hit atop the order and the worst hitters hit at the bottom. Plus, batting first through third you still have some competent hitters behind you to drive you in. Bat fourth through sixth and you’re counting on less productive hitters to get you home.
- You come to the plate more frequently the higher you bat in the order, as seen above.
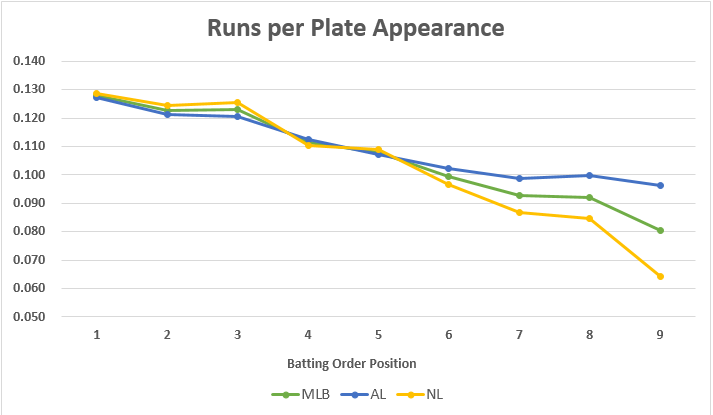
Let’s look at runs scored per plate appearance to demonstrate the increased likelihood you will score a run by hitting higher in the order. You see a steady decline in R/PA as a player moves down the order.
Lead off hitters in the AL score nearly 0.130 runs for each plate appearance while batting ninth drops that rate to below 0.100 runs per PA.
Things get much uglier in the NL, where the pitcher bats. So not only does the pitcher score fewer runs (because they’re not good at getting on-base), but they also drag down the run scoring ability of the 6, 7, and 8 hitters (they can’t drive them in).
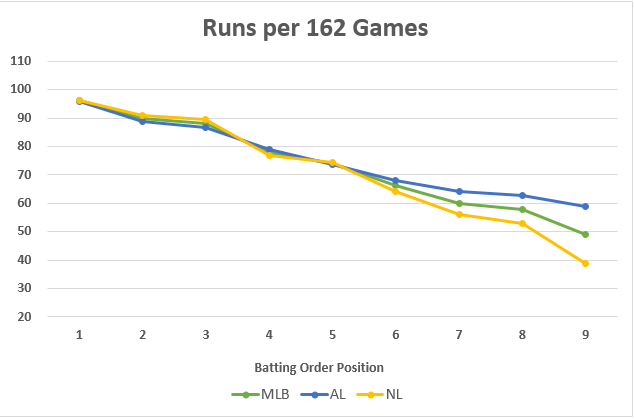
If we combine the increased plate appearances and increased R/PA rates for hitters higher in the order, we can see the projected runs per 162 game season for the typical lead off hitter (please note these are for a full 162 games season, so if a player might only get in 140 games you’ll need to adjust accordingly).
In the hypothetical scenario where a young up and coming 9-hitter gets promoted to the top of the order, we might expect his projected runs scored to jump from around 60 to nearly 95. Or flip the scenario if an aging lead off hitter gets demoted to the bottom of the order.
RBI
Similar to runs scored, RBI are affected by two factors:
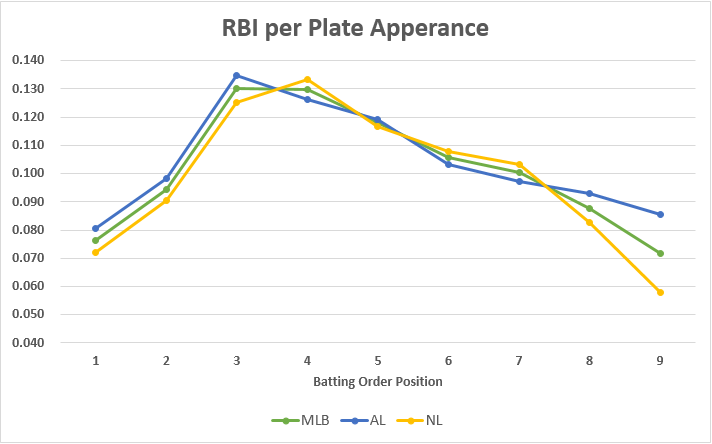
- The closer you bat to the third and fourth spots in the lineup, the more likely you are to drive in runs. This is because lineups generally have players with high on-base percentages batting near the top of the lineup, so the three and four hitters have more opportunities to bat with men on. And the three and four hitters are usually very strong hitters themselves, meaning the five, six, and seven hitters have chances to drive them in.
- You come to the plate more frequently when you bat high in the order.
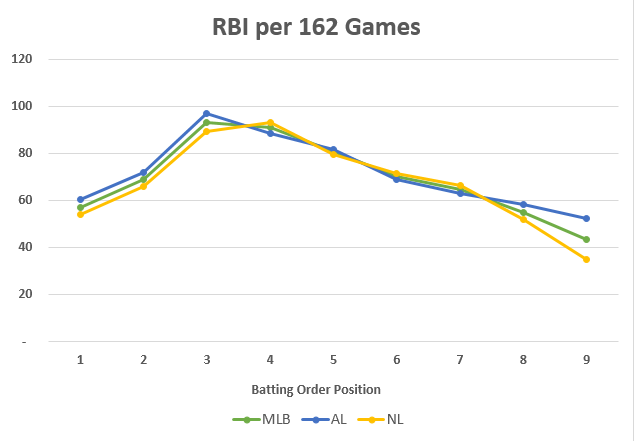
The effect of hitting third or fourth is dramatic. There’s something to be said for trying to load up on three and four hitters during the draft. A sneaky example of this is that Adam Lind, not someone you might expect, usually hit cleanup for TOR during the 2013 season (when he was healthy and they were facing a RHP, at least).
If we combine the increased plate appearances and increased RBI/PA rates for hitters batting third or cleanup, we can see the projected RBI per 162 game season jump up to over 90. Take that same hitter and drop him to sixth and you’re talking 70 RBI.
The example I like to use for this is that (during the 2014 season at least) the Royals will shuffle Sal Perez around the order a lot, frequently batting him third, fourth, or fifth. Ninety four of his games played were in one of those spots. That’s how you can squeeze 70 RBI out of a catcher when most others are going to have about 50 or 60 RBI.
How To Use This Information
This stuff matters. The strategies we employ in fantasy baseball are not that different than from the concepts in Michael Lewis’ “Moneyball” or Jonah Keri’s “The Extra 2%”. Whether you’re an MLB GM or a fantasy baseball player, we’re playing the game against a bunch of other (generally) competent folks. We need to seek out those smaller bits of information that can give us a slight edge over the competition.
I think it’s unlikely that guys in my home leagues know where their players hit in the order. And if you’re in a more competitive league, you’re competition surely does consider these things. So whether you’re trying to gain a small advantage or just keep up with the Joneses, this is something to consider when making roster decisions.
If you see that a player has been moved to a new spot in the lineup, then that player’s projected stats for the year can be adjusted accordingly.
It’s also something to monitor during the season by looking at box scores or the Baseball-Reference historical batting lineup tool (image below). If you see that a player has been moved to a new spot in the lineup for several days and can determine that it’s likely more than just because players were resting or dealing with nagging injuries, then that player’s projected stats for the year can be adjusted accordingly.
Think about it. This really can be a great way to squeeze and extra 20 or 30 R and RBI out of the season. 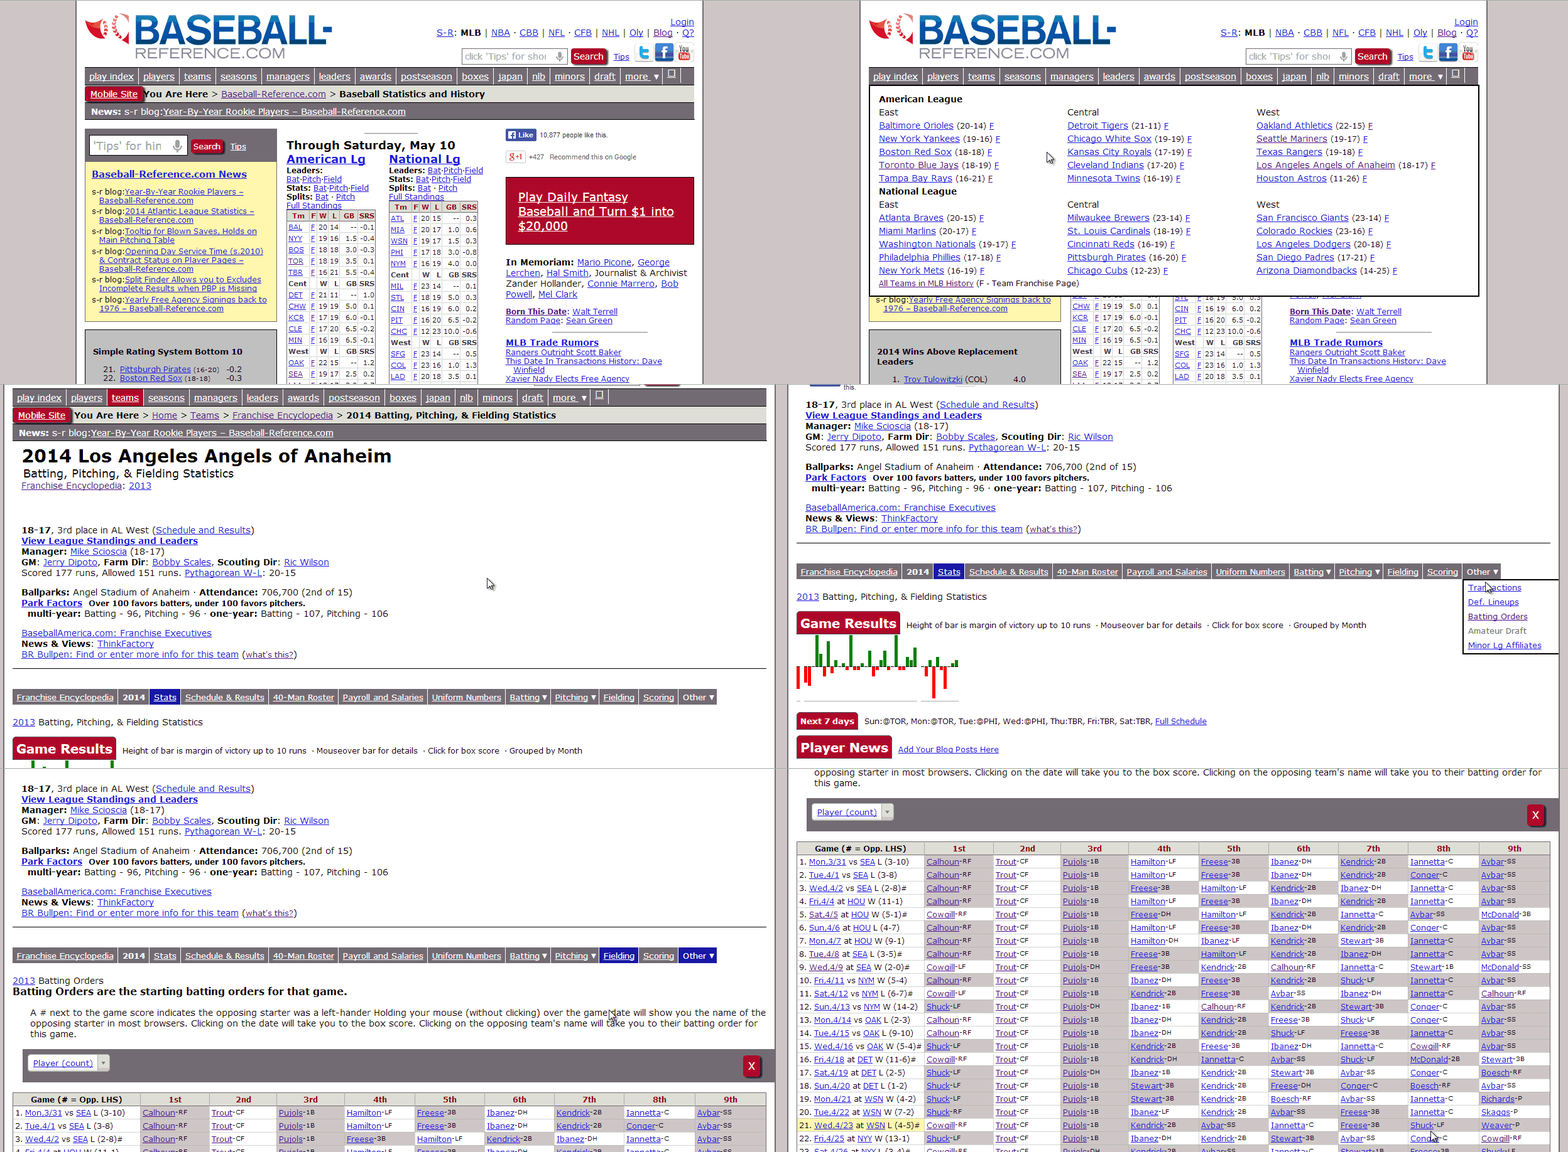
The Contrarian’s Point Of view
Don’t overreact to lineup changes. Lineups are fluid and they change a lot. For example, during the 2014 season the Angels had 125 different lineups. The most common lineup was only used SIX times!
I Know What You’re Thinking
“This is all fine and dandy. But if I move a terrible hitter from batting 8th and bat him cleanup, he’s not going to automatically drive in 90 runs.”
You’re right.
Here’s a look at what the average batting lines were for each of the lineup spots below (all of MLB). If the player you’re evaluating moves to the leadoff spot and has an OBP over .326, you can probably expect more than 0.130 R/PA from him. Or if he hits in front of three and four hitters with SLG greater than .450 and .422, adjust his R/PA accordingly.
I’m getting to have a lot of tables and charts in this post, so visit Baseball Reference if you want to see the AL-only information or the NL-only information.
| Split | ||||
|---|---|---|---|---|
| Batting 1st | .268 | .326 | .389 | .715 |
| Batting 2nd | .261 | .321 | .393 | .714 |
| Batting 3rd | .276 | .350 | .450 | .800 |
| Batting 4th | .256 | .329 | .422 | .751 |
| Batting 5th | .257 | .318 | .413 | .732 |
| Batting 6th | .244 | .303 | .382 | .685 |
| Batting 7th | .246 | .304 | .381 | .685 |
| Batting 8th | .241 | .305 | .348 | .653 |
| Batting 9th | .200 | .251 | .280 | .531 |
References
Here are the links to the actual 2014 pages at Baseball-Reference for the tables shown below.
- MLB batting order split data for the 2014 season
- American League batting order split data for the 2014 season
- National League batting order split data for the 2014 season
Or if you’re looking for a simple way to find the data for other seasons, you can just manipulate the URL below (you might be interested in “Fun with URLs and Player IDs“). Change the red text to see a different year. Change the blue text to either “MLB”, “AL”, or “NL” to see a specific league.
http://www.baseball-reference.com/leagues/split.cgi?t=b&year=2014&lg=MLB#lineu
Table Data
If you’re interested in seeing the data behind the charts above…
MLB Batting Order Splits
| Split | PA | PA/G | R | R/PA | RBI | RBI/PA |
|---|---|---|---|---|---|---|
| Batting 1st | 22,511 | 4.63 | 2,882 | 0.128 | 1,718 | 0.076 |
| Batting 2nd | 21,955 | 4.52 | 2,694 | 0.123 | 2,070 | 0.094 |
| Batting 3rd | 21,489 | 4.42 | 2,643 | 0.123 | 2,794 | 0.130 |
| Batting 4th | 20,999 | 4.32 | 2,337 | 0.111 | 2,726 | 0.130 |
| Batting 5th | 20,529 | 4.22 | 2,218 | 0.108 | 2,422 | 0.118 |
| Batting 6th | 19,952 | 4.11 | 1,985 | 0.099 | 2,107 | 0.106 |
| Batting 7th | 19,414 | 3.99 | 1,801 | 0.093 | 1,946 | 0.100 |
| Batting 8th | 18,840 | 3.88 | 1,735 | 0.092 | 1,654 | 0.088 |
| Batting 9th | 18,240 | 3.75 | 1,466 | 0.080 | 1,309 | 0.072 |
American League Batting Order Splits
| Split | PA | PA/G | R | R/PA | RBI | RBI/PA |
|---|---|---|---|---|---|---|
| Batting 1st | 11,294 | 4.65 | 1,438 | 0.127 | 908 | 0.080 |
| Batting 2nd | 11,008 | 4.53 | 1,333 | 0.121 | 1,080 | 0.098 |
| Batting 3rd | 10,768 | 4.43 | 1,298 | 0.121 | 1,452 | 0.135 |
| Batting 4th | 10,517 | 4.33 | 1,182 | 0.112 | 1,329 | 0.126 |
| Batting 5th | 10,292 | 4.24 | 1,103 | 0.107 | 1,228 | 0.119 |
| Batting 6th | 9,992 | 4.11 | 1,023 | 0.102 | 1,032 | 0.103 |
| Batting 7th | 9,728 | 4.00 | 961 | 0.099 | 947 | 0.097 |
| Batting 8th | 9,435 | 3.88 | 940 | 0.100 | 877 | 0.093 |
| Batting 9th | 9.156 | 3.77 | 883 | 0.096 | 784 | 0.086 |
National League Batting Order Splits
| Split | PA | PA/G | R | R/PA | RBI | RBI/PA |
|---|---|---|---|---|---|---|
| Batting 1st | 11,217 | 4.62 | 1,444 | 0.129 | 810 | 0.072 |
| Batting 2nd | 10,947 | 4.50 | 1,361 | 0.124 | 990 | 0.090 |
| Batting 3rd | 10,721 | 4.41 | 1,345 | 0.125 | 1,342 | 0.125 |
| Batting 4th | 10,482 | 4.31 | 1,155 | 0.110 | 1,397 | 0.133 |
| Batting 5th | 10,237 | 4.21 | 1,115 | 0.109 | 1,194 | 0.117 |
| Batting 6th | 9,960 | 4.10 | 962 | 0.097 | 1,075 | 0.108 |
| Batting 7th | 9,686 | 3.99 | 840 | 0.087 | 999 | 0.103 |
| Batting 8th | 9,405 | 3.87 | 795 | 0.085 | 777 | 0.083 |
| Batting 9th | 9,084 | 3.74 | 583 | 0.064 | 525 | 0.058 |
Good point. I think it’s as important, if not more, to look at a guy’s spot in the order than to look at how many runs his team will score. The same guy on a crappy team could easily have as many or more R/RBI as he would on a great team. Because on a great team, he might bat 7th., whereas on the crappy team he could bat 2nd or 3rd. It really depend son the situation.
For example, this year the Braves are terrible. Just atrocious. But if Jose Peraza gets called up in May and bats leadoff for the rest of the year (which seems like a decent possibility), he could be a surprising source of runs for a guy that a) can’t really hit and b) is on the worst offensive team in the majors. He will also get a ton of chances to steal. Whereas if he was on the Nationals, he likely bats 8th. He would get far fewer at-bats, he won’t have sluggers to knock him in if he gets on base, the pitcher bats after him which not only means he’s unlikely to get knocked in, but also that they won’t let him steal because there’s little upside and a lot of downside. So in this case it’s much better for him to be on a crappy team than a great team.
Even last year with Stanton, I saw a lot of people argue that he won’t get any RBI because the Marlins are terrible. I ended up with him in pretty much all my leagues. He was a great source of not only RBI, but Runs too. He batted 3rd all year which got him a lot of plate appearances, and even on a crappy team like Miami there are one or two decent enough hitters to put 1 and 2 in the order.
Interesting stuff. In your research, I am wondering if you happened to look at Team Runs/Plate Apperances on a per game basis? That is, if a team scores Y runs in a game, what would you predict their Team PAs to be. Something like Y = Ax + B.
Hi, DMM. Thanks for commenting. I have not done that, but I love the idea. I’ll work on breaking down the data some more so we can dive into that next level. Stay tuned. I’ll try to get a piece together on what I find.
Thanks again, DMM. Here’s the piece I wrote to answer your question: https://www.smartfantasybaseball.com/2015/11/how-to-project-plate-appearances/
1. The Best hitter is almost always in the Three slot. 2. Man on Base W/2 out opportunities are never discussed ? Take a batters SLG % in those opportunities with the base runners moving either on the pitch or in 2 strike counts, before the pitch. 2 out opportunities with a RISP or Man on Base are the toughest hitting situations but they can lead to scoring runs in bunches !
As far as RE24, any metric system that negates the use of situations to equate value should be minimized as legitimate sources. Take for instance “RE24” in the 3rd game of the season in 2012. Detroit trails Boston 7-10 in the bottom of 9th 2 on with no outs. Cabrera hits a tying 3 run HR. Detroit trails again by 10-12 in extra innings and Cabrera reaches base and scores in helping Detroit win 13-12. Cabrera goes 3 for 5 with 3 runs scored and 5 RBI’s but because he hit into a double play with a single runner on base, MIGGY is given a 2.15 for his performance ? I have seen performances that are awarded larger values when their team is being blown, but because the player didn’t hit into a pre-valued double play, that player will not have their RE24 performance be minimized. A 2.15 for that situational performance is a INJUSTICE !
What about RBI opportunities? Straight RBI production figures are skewed by the quality of a hitter that is generally in a given lineup position. Teams usually put their best hitters at 3 and 4 so it seems like RBI opportunities per plate appearance and total RBI opportunities per season would be more telling. TY
Hi Jo,
Thanks for the suggestion. I do agree this would be interesting to see. In addition to just “good hitters” I bet there are some that can execute more efficiently to knock in runs.
My issue is that I am not familiar with where to download or view RBI opportunity data so that it can be incorporated.
If you know of some, please let me know.
Thanks, Tanner