If an average hitter is bumped from the sixth spot in the batting order to the two-hole, how much of a bump in performance can we expect?
I’ve written a little about this before. Mostly just suggesting that this is something to keep in mind when you’re looking for hidden value. And I always had in the back of my mind that when I finally got around to downloading all the retrosheet game logs for each season AND learned SQL that I could figure out exactly how much of a benefit this would represent.
Then my five-year old daughter starts playing soccer and is bringing homework back from kindergarten, my sister and twin sister-in-laws all decide to get married in a two-year period, work gets in the way… and before I know it those plans of teaching myself how to process game logs are out the window!
Thankfully though, I stumbled upon the league splits page for the 2014 season at Baseball-Reference.com. And it has the batting order splits already calculated for me!
Charts and Table Data
I have taken the 2014 data from Baseball Reference tweaked it some. You will first see a series of charts depicting the batting order splits for 2014. Then after the charts you will see tables showing the MLB, AL-only, and NL-only data.
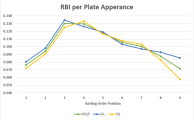
I’ve added calculations for Plate Appearances per Game, Runs per Plate Appearance, and RBI per Plate Appearance.
These measures are all important inputs when I’m projecting a player’s performance (side note, if you are interested in projecting stats here is the approach I use). Knowing (or estimating) where a player will bat in the order affects the number of times they’ll come to the plate during the season. That spot in the order also affects their run scoring and run driving productivity. You’re more likely to score batting in front of the 3- and 4-hitter than you are batting seventh.
Plate Appearances
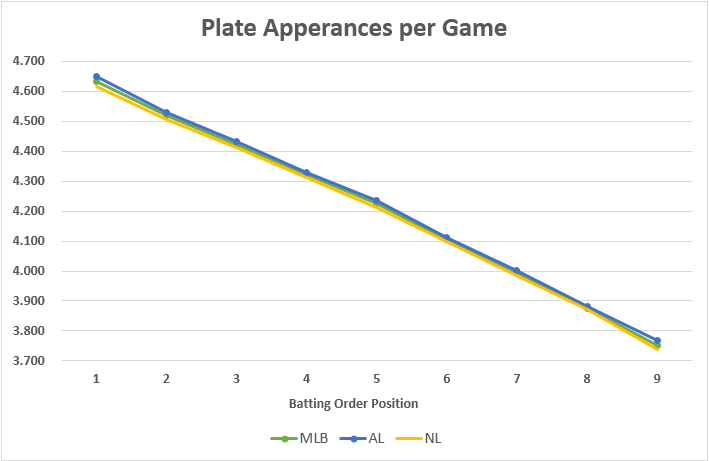
The graph below shows that for every spot a player drops in the lineup, they can expect to see about 0.10 or 0.11 fewer plate appearances per game. Over the course of a 162 game season that is about 16 plate appearances. Fall from second in the order to 7th, you’re looking at 80 less plate appearances.
Notice that there’s really not much of a difference between the AL and NL in terms of plate appearances for any spot in the lineup.


