Why do your spreadsheets have so many tabs?
When you’re building a rankings spreadsheet, why don’t you just build the calculations right on the projection tab?
Why do you even use this ridiculous Player ID map? There’s so much useless information on that thing.
Have You Ever Wondered These Things?
I have to say that I haven’t had anyone ask these questions, but I feel the need to address the questions nonetheless. I don’t mean for them to be overly complicated, but there’s a good chance that the spreadsheets I design can be overwhelming. So let’s take a closer look at the reasoning behind things.
There Is More Than One Way To Skin a Cat
I don’t think it’s much of a stretch to say that spreadsheet design is a form or art. There are many different ways to get to the same end goal. I’m always looking for new ideas and methods to add to my Excel work, and I’m certain there are more efficient and better ways to design things I have done.
With that said, I believe the principles I’m about to talk about are universal. Whether you like the way I’ve designed things or if you prefer to do things a different way, using these concepts should help you out in the long run.
Why Do Your Spreadsheets Have So Many Tabs?
There are two main reasons for this:
- I want all of my spreadsheets to be reusable.
- I try to set things up so you only have to enter a piece of information one time.
Reusable Spreadsheets
We’ll take a close look at reusable design in a moment, but think about the different tabs/worksheets I use. Raw projections, player information, replacement level information, and calculations all on separate worksheets.
By setting these up on distinct areas of a spreadsheet it allows you to easily update one of those components without screwing up the whole model. Have new projection info? Just replace the data on the projection tab. Have a new Player ID Map? Just copy it over top of the existing one.
This setup makes it much easier for your work to be updated during the season and into future seasons.
Entering Information Only Once
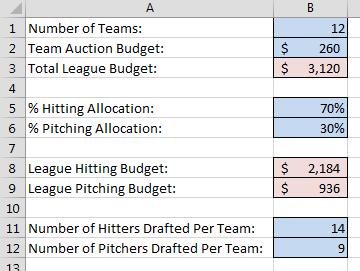
 If you’ve read my book on calculating dollar values and in-draft inflation, you’ll recall that we added a “Settings” tab to the rankings spreadsheet. On that tab we color-coded blue cells to indicate input cells.
These are just basic settings about the league, but by separating them out onto the “Settings” tab you only have to type the information one time. If we didn’t do this, we would have to embed this information into our calculations for both the hitting and pitching rankings.
Everything is also formula-driven, so if a 13th team is added next year, or if team salary caps increase, or if you want to try a 65% hitting allocation, you can easily change those inputs and all calculations for hitters and pitchers update automatically.
If we didn’t have things set up this way you would have to search deep inside complex formulas on the hitter tab and edit these inputs. And then you’d have to go do the same thing on the pitcher rankings.
And if you’re in more than one league you can set your rankings up for one league, just change the few settings different between the leagues, and you’ll easily have rankings tailored to each league you play in.
Why Don’t You Just Build Your Calculations Right on the Projections Tab?
Whether you’ve downloaded projections from another website or you’ve created your own, it might seem like I’m over-complicating things by having the projections on one tab and then using formulas to pull the projections to a whole other worksheet where I then calculate rankings, SGP, and dollar values.
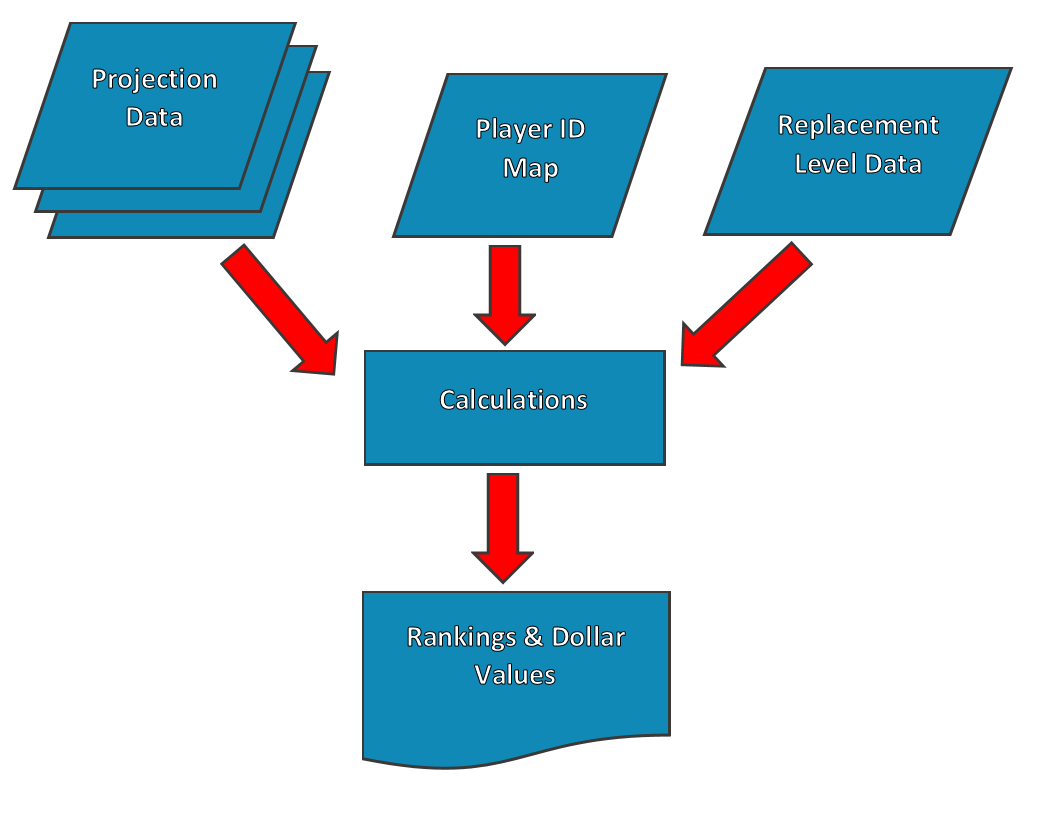
If I were to use this spreadsheet one time, I would agree with this line of thinking. But take a look at this image.
 This is a very primitive flow-charting model of a rankings spreadsheet. You have a few sets of raw data as inputs (the blue rhombuses, or is it rhombi?) – the projections, the Player ID Map, and replacement level data.
These inputs then flow into the calculations and the output our rankings and dollar values.
 If you’re not familiar with flow-charting (I’m no expert myself, I had a class in college about 15 years ago about process modelling), there’s something subtle different about the projection data.
The multiple or stacked shapes indicate the spreadsheet can accommodate multiple sets of projection data. What I’m trying to indicate here is that this spreadsheet is easily reusable with an updated set of projections.
It does take longer to “set things up the right way”. But I’m hopeful that if you follow this line of thinking, you’ll be able to just drop in an updated set of projections at any point in time.
Set up the spreadsheet once in the preseason. Add new projections as updated versions come out. Drop in new rest of season projections once the season starts. Continue to do that all season long. Reuse your spreadsheet every season into the future with minimal maintenance required.
If you build your calculations directly next to the set of projections you’ve downloaded it becomes much more complicated to reuse the spreadsheet. It’s no longer as simple as just downloading a new set and dropping them in.
Why Do You Even Use This Player ID Map?
This serves two main functions, the first is that it allows us to bring information from different resources together for things like averaging projections.
The second function, more in line with the topic of spreadsheet design, has much to do with the concept of only entering information once into a spreadsheet.
In addition to having IDs from a variety of systems, the Player ID Map contains a variety of information about each player (position, birthdate, team, etc.).
All of these pieces of information, some which change over time, are pulled and used throughout the Excel files I design. But by keeping all of this information on one tab, it’s very easy to update the information that does change.
Even for the information that does not change, it’s nice to have all of this in one central spot. There’s no point in entering Mike Trout’s name, position, and team on every tab. We can just use his Player ID and easily pull any related information about that player ID.
Do I MIss The Boat?
I’d love to hear from you if you have any suggestions on how I could improve any of the spreadsheets I share on this site (projections, rankings, pitch type comparisons, etc.).
Also, don’t hesitate to e-mail me (smartfantasybaseball at gmail dot com) with any questions about something you’re trying to do in your own baseball spreadsheet work.
If you’d like to be notified when I post new articles, please follow me on Twitter. Stay smart.


[…] I’m designing a reusable spreadsheet, the initial hurdle is just to get all the information into the file. We can then use VLOOKUPS and […]
Thought: change all DH identified players in the ID map to some other position to make it easier to deal with replacement level players and position scarcity calculations with the RSGP. I do it manually, but then have to re-do it every time the ID Map refreshes, and to leave them as DH screws up the formulas. There are usually only 12 or so of these guys, so it doesn’t make a lot of sense to keep them as DH only. (people can always make a note or color code them on their rankings tabs to indicate their limited position eligibility for their particular league if need be).
Hi Rocky,
That’s an interesting suggestion. The way I handle DH is by putting a line for “DH” directly into the replacement level table. Just like it’s any other position. I make the formula for the SGP relating to that position equal to the MAX of the totals above. So after I’ve entered the replacement level for 1B, 2B, SS, etc., the DH replacement is calculated automatically as the highest of any single position’s replacement level.
My reasoning is that you would not select a “DH-only” player if there were other players available still with higher expected SGP. Therefore, replacement level for a DH player has to be the highest level of all other positions.
I think tracking that a player is considered “DH-only” is important information in the Player ID Map.