Why do your spreadsheets have so many tabs?
When you’re building a rankings spreadsheet, why don’t you just build the calculations right on the projection tab?
Why do you even use this ridiculous Player ID map? There’s so much useless information on that thing.
Have You Ever Wondered These Things?
I have to say that I haven’t had anyone ask these questions, but I feel the need to address the questions nonetheless. I don’t mean for them to be overly complicated, but there’s a good chance that the spreadsheets I design can be overwhelming. So let’s take a closer look at the reasoning behind things.
There Is More Than One Way To Skin a Cat
I don’t think it’s much of a stretch to say that spreadsheet design is a form or art. There are many different ways to get to the same end goal. I’m always looking for new ideas and methods to add to my Excel work, and I’m certain there are more efficient and better ways to design things I have done.
With that said, I believe the principles I’m about to talk about are universal. Whether you like the way I’ve designed things or if you prefer to do things a different way, using these concepts should help you out in the long run.
Why Do Your Spreadsheets Have So Many Tabs?
There are two main reasons for this:
- I want all of my spreadsheets to be reusable.
- I try to set things up so you only have to enter a piece of information one time.
Reusable Spreadsheets
We’ll take a close look at reusable design in a moment, but think about the different tabs/worksheets I use. Raw projections, player information, replacement level information, and calculations all on separate worksheets.
By setting these up on distinct areas of a spreadsheet it allows you to easily update one of those components without screwing up the whole model. Have new projection info? Just replace the data on the projection tab. Have a new Player ID Map? Just copy it over top of the existing one.
This setup makes it much easier for your work to be updated during the season and into future seasons.
Entering Information Only Once
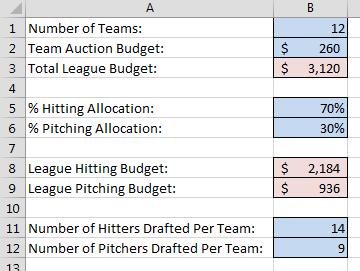 If you’ve read my book on calculating dollar values and in-draft inflation, you’ll recall that we added a “Settings” tab to the rankings spreadsheet. On that tab we color-coded blue cells to indicate input cells.
These are just basic settings about the league, but by separating them out onto the “Settings” tab you only have to type the information one time. If we didn’t do this, we would have to embed this information into our calculations for both the hitting and pitching rankings.
Everything is also formula-driven, so if a 13th team is added next year, or if team salary caps increase, or if you want to try a 65% hitting allocation, you can easily change those inputs and all calculations for hitters and pitchers update automatically.
If we didn’t have things set up this way you would have to search deep inside complex formulas on the hitter tab and edit these inputs. And then you’d have to go do the same thing on the pitcher rankings.
And if you’re in more than one league you can set your rankings up for one league, just change the few settings different between the leagues, and you’ll easily have rankings tailored to each league you play in.
Why Don’t You Just Build Your Calculations Right on the Projections Tab?
Whether you’ve downloaded projections from another website or you’ve created your own, it might seem like I’m over-complicating things by having the projections on one tab and then using formulas to pull the projections to a whole other worksheet where I then calculate rankings, SGP, and dollar values.
If I were to use this spreadsheet one time, I would agree with this line of thinking. But take a look at this image.
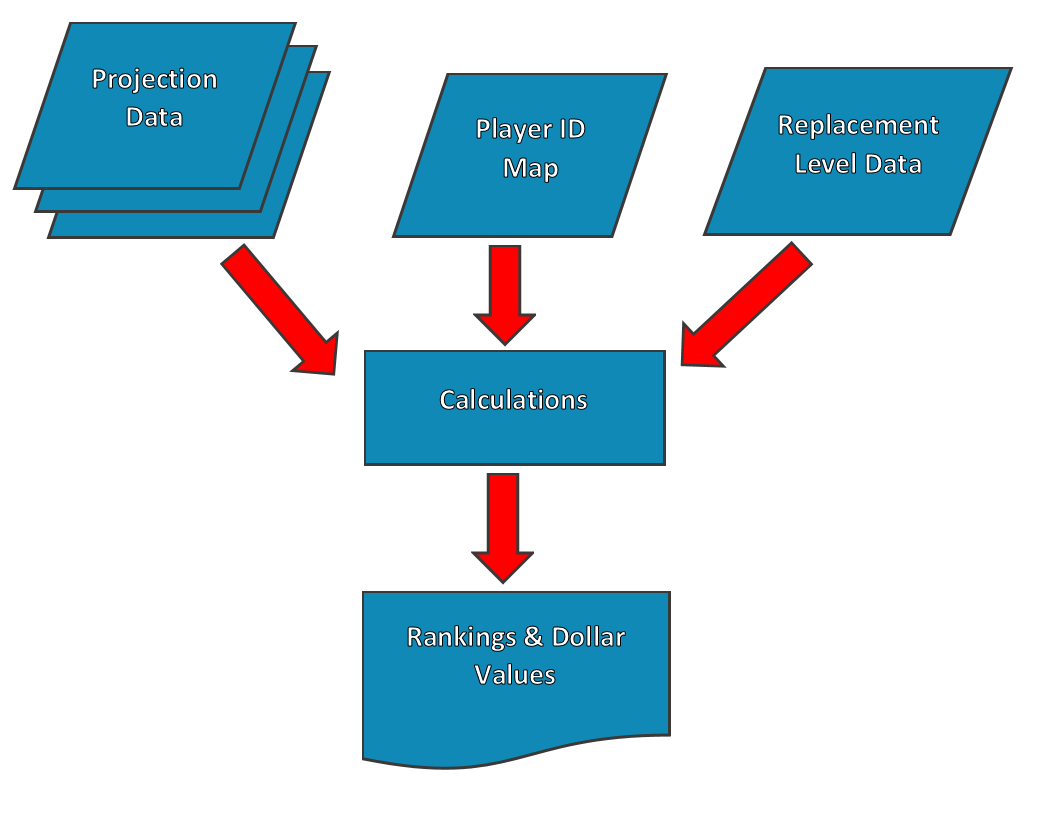 This is a very primitive flow-charting model of a rankings spreadsheet. You have a few sets of raw data as inputs (the blue rhombuses, or is it rhombi?) – the projections, the Player ID Map, and replacement level data. Continue reading “Designing Reusable Fantasy Baseball Spreadsheets”
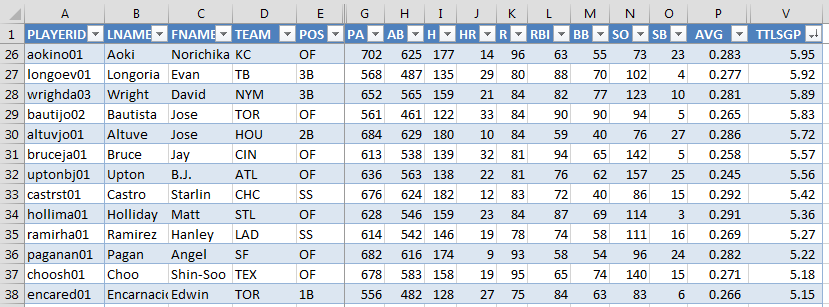
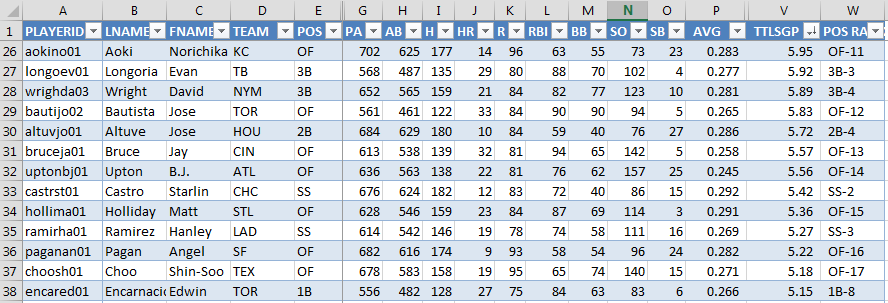
 Continue reading “How To Add Positional Ranking To Your Spreadsheet”


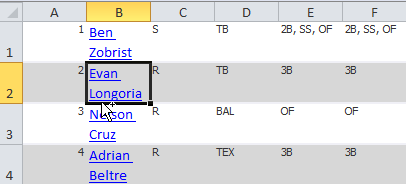 There’s not even an existing Excel formula we can use to just pull out the web address. We have to get a little advanced and create our own.