Welcome to the final part of the series in which we go through the process of plugging Steamer’s Rest of Season (RoS) projections into your existing ranking/dollar value spreadsheet so you can make informed and objective roster decisions during the season.
If you register as an SFBB Insider (it’s free), you can receive the entire series in an easy-to-use e-book (also free) along with two other helpful guides. I’ve also written a comprehensive guide on ranking players and calculating player dollar values that’s available at Amazon.
Introduction
In this sixth part of the series we will revisit the concept of replacement level and adjust replacement level for our updated RoS projections.
Reminders About Replacement Level
If you’re new to the concept of replacement level read the introduction here (don’t go into the “Step-by-Step Instructions”. When you consider the injuries that occur in Major League Baseball, rookies being called up, players underperforming projections, and others exceeding projections, the player pool is constantly changing.
In order to make the best possible decisions and to calculate representative dollar values, it is very important that we update the estimate of replacement level.
Caution: No Further Adjustments Necessary
When listening or reading fantasy advice, you might come across a piece of advice that goes something like this, “You really need to draft a SS early to account for the lack of depth at the position. Go ahead and reach for that shortstop.”
Don’t listen to that advice when you’re using the approach we’re now going through. The replacement level adjustment that follows is already calculating the effect of depth at each position. And it does it mathematically. There is no guesswork going on here.
DON’T MAKE ANOTHER ADJUSTMENT.
You do not need to make an arbitrary adjustment to shortstops or catchers, or any other position. When you have added this adjustment to your rankings, each player will be ranked according the their value over the worst players at the position. If the position is weak, that’s accounted for. If the position is deep, it’s accounted for.
If you then decide to make arbitrary adjustments to your rankings after adding in the replacement level calculation, YOU ARE DOUBLE COUNTING.
You will be reaching for players and you will be hurting your team. Don’t “bump” players up a list because of their position.
Step-By-Step Instructions
| Step | Description |
|---|---|
| 1. |
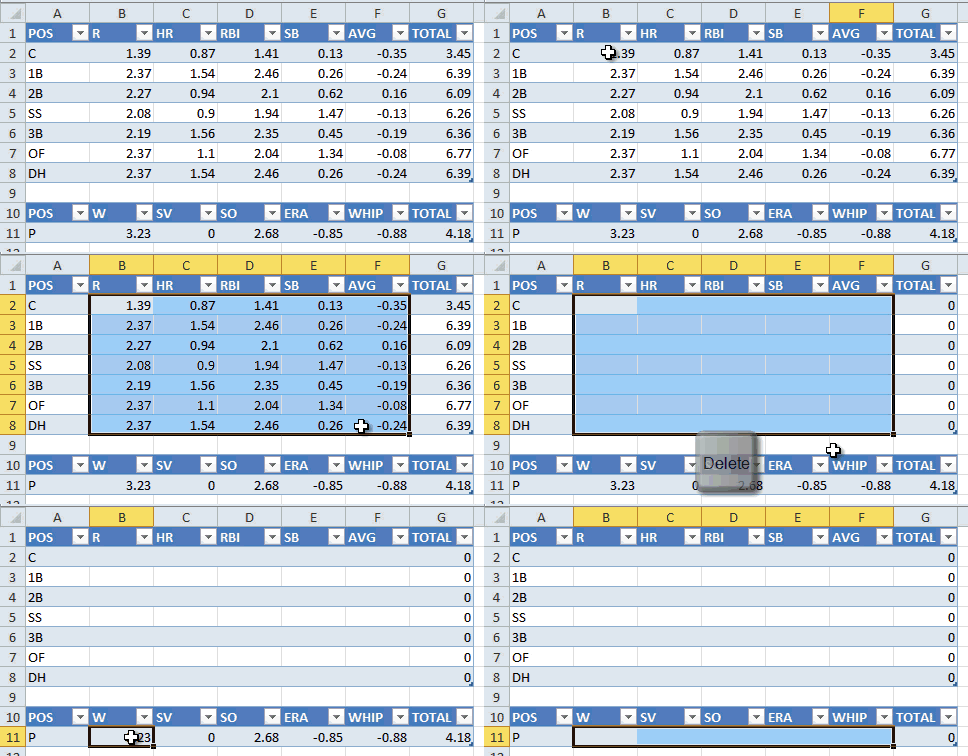
Locate the “Replacement Level” tab in your spreadsheet. Select the replacement level data for the various categories (leave the “TOTAL” column) and hit the Delete key. Do the same for pitchers. |
| 2. | Return to the “Hitter Ranks” tab. Use the drop down arrow on the “TTLSGP” column to ensure it is sorted in descending order (largest to smallest).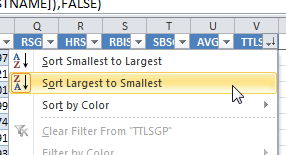 |
| 3. | Click on the downward pointing arrow on the “POS” column. Clear all the position check boxes and select only “C”. Click “OK” to accept this filter.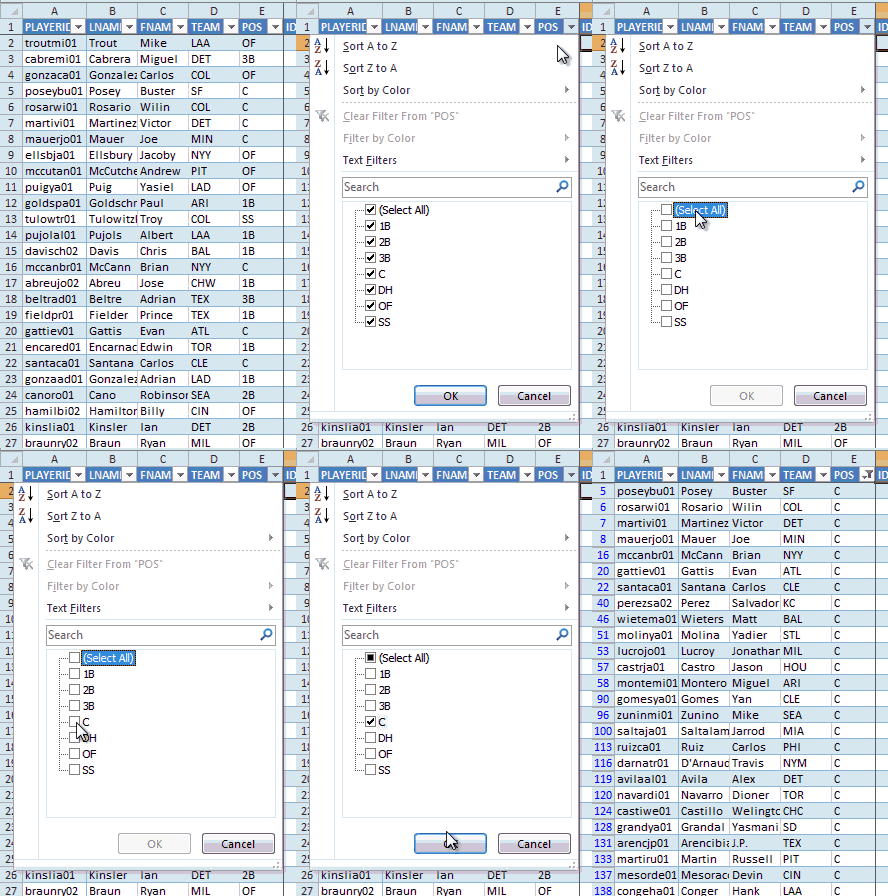 |
| 4. |
I believe that identifying one specific player as “replacement level” can be misleading and that it is best to develop a “composite” of the replacement level player. For example, what if the 25th catcher happens to steal a lot of bases and all his value comes from this stat. It would be misleading to compare all the other catchers to this player. To calculate this approximate replacement player I suggest creating an average of five players. The average will be of the last draftable player and the two players above him and the two players below him. Sticking with our example that 24 catchers will be drafted, I will use catchers #22, #23, #24, #25, and #26. Any easy way to figure out who these catchers are is to choose a specific column, click on the value for the first player in the column, and then click and drag to select more players (you can see an image of this to the right, make sure you are highlighting only one column). As you continue to select more players, watch the “Count:” field on the Excel status bar. |
| 5. |
In looking at the 22nd – 26th best catchers, I see a rough average of 1.39 SGPs in R, 0.87 in HR, 1.41 in RBI, 0.13 in SB, and -0.35 in AVG (these will vary for you based upon the different player pool and the different RoS projections when you calculate your adjustment). Note that if you select the RSGP information for catchers #22-#26 as shown above, Excel will display the average on the status bar in the lower right hand corner of the program. |
| 6. | Enter these averages into the Catcher row on the “Replacement Level” tab.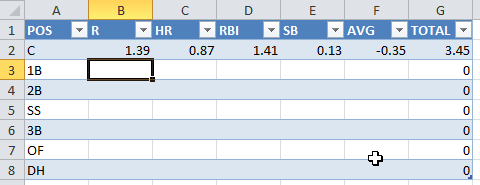 |
| 7. | Repeat steps 3 – 6 for eachposition.If your league starts Corner Infielders and Middle Infielders, you can likely assume that will break down into an even split between1B &3B and2B & SS. For example, in a 12-team league with a CIposition, a total of 361B or3Bwill be drafted (121B, 123B, and 12 CI). I usually assume this will break down to 181B and 183B. This won’t be exact, but splitting hairs about this will not result in much of a benefit to your rankings.You must perform a similar adjustment for the DH/UTIL spot in your league. Again, assuming a 12-team league, we must now adjust replacement level by 12 more players. I generally assume this will result in 6 more OF being drafted and 6 more 1B, because 1B and OF are generally the most productive positions. This means that I assume 24 1B will be drafted (12 to play 1B, 6 to play CI, and 6 to play DH/UTIL) and 66 OF (60 to play OF (5 * 12-teams), 6 to play DH/UTIL).It is important to keep in mind that these numbers are highly dependent upon two things that will cause the numbers I present below to differ from what you will see as you work with your own spreadsheet: |
- The underlying projections used
- Your league settings
The projections you use will surely be different from those I used to create this guide. For one, I created this guide using the 2013 Steamer projections. You will be using some projection set you obtained after 2013. The projections you use determine the statistics of the replacement level player. So your replacement level player will not be the same as mine.
Further, your league settings may be different. I am assuming a 12-team league starting 2 catchers. If you have a 10-team league or if your league starts only one catcher, your definition of who the replacement level player is will be different.
TIP: Because you might be updating the RoS projections several times during the season, you can take a shortcut and only determine the total SGP of the replacement level player, instead of calculating it category by category. I like to see this information in the preseason, but as the season goes along, speed in updating the spreadsheet becomes more important.
You can see that I’ve just typed the total SGP of the replacement level player for each position (except Catcher). I type it in the average column so I don’t destroy the TOTAL column formula already in place. 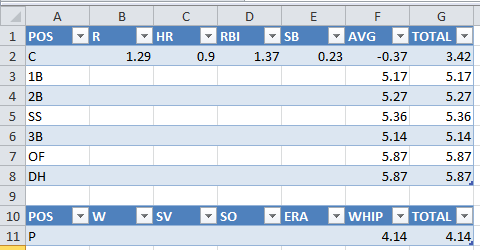 8.Perform steps 2-6 in order to update the pitchers replacement level table on the Replacement Level tab.9.It’s possible that some players would rise or fall in the total SGP ranking after these changes. Sort the hitter and pitcher ranks from highest value to lowest value again using the drop down arrow over the “TTLSGP” column.
 10.It is extremely important toperform a reasonableness check when you’re done with this exercise. If you have done everything correctly, when you’re done, you should see that the number of players with positiveSGPsshould beapproximately equal to the number of players your league will draft.For example, I have been assuming a 12-team league where each team drafts 14 hitters. This means 168 hitters will be drafted. If I look in my “Hitter Ranks” tab, I should see that the players right around the #168 mark will have very close to 0.00 for TTLSGP.
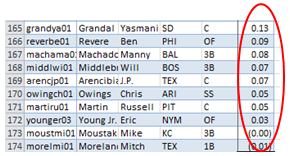 Row #169 represents the 168th player (accounting for the header row in the sheet). And you can see everyone here is about at 0.00 SGPIf you find that you have too many players above 0.00 TTLSGP, you must raise your replacement levels. If the replacement level averages are higher, fewer players will come out above 0.00.
If you have too few players above 0.00 TTLSGP, you must lower your replacement levels. If replacement levels are lower, more players will come out above 0.00.11.You did it!
If You Have Calculated Dollar Values

If you have calculated dollar via the “Using Standings Gain Points to Rank and Value Fantasy Baseball Players” guide, use the $VALUE column (not $ACTUAL and not $INFLATE) for your decision making. In fact, once the season begins, you can delete the $ACTUAL information because it becomes irrelevant after the draft.
If after working through this guide, you’re interested in purchasing the instructions on calculating dollar values, the step-by-step e-book is available here.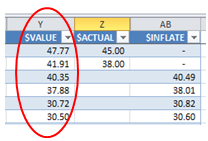
Final Thoughts
After you work through this process one time, your subsequent attempts will be much faster. First, adding the IFERROR formula is a one-time process. You won’t need to add this each subsequent time you download new RoS projections. Second, updating the Player ID Map likely does not need to be done each time. The player pool does not turn over that frequently.
Essentially you only need to download new RoS information, paste it into your file, and update the replacement level information.
You can probably get to a point where you can perform these steps in a matter of minutes.
Here’s to a season full of smart and informed decisions!
LINK TO DOWNLOAD EXAMPLE EXCEL FILE – RoS-Rankings-and-Dollar-Values-Part-6.XLSX
QUESTIONS?
Do you have questions about Part 6? Or want to see what others have asked? Comment below.
 Use your league settings to develop an approximation of how many catchers will likely be drafted. For example, in a 12-team league in which each team starts two catchers, there likely won’t be any catchers starting at the DH/UTIL spot. This means that 24 catchers will be drafted and the 25th catcher represents replacement level.
While the efforts that you have put forward on this site is tremendous, much of the work and data dependencies described are just too manual at the end of the day. Pulling in data and adding in new player IDs is still dependent on the master source, you, to work. True data APIs from Baseball Reference of Fangraphs is non-existent though; so this is pretty much the next best thing.
Thanks.
Hi Richie,
You bring up an excellent point. I started this as a silly little hobby trying to help a few folks take a more advanced approach to fantasy baseball… My process moves the ball some of the way, but some of the methods I describe are very reliant upon me… Which is a bit problematic now that I’m not able to devote as much time as I could in the past (my wife and I just welcomed our third child in May!).
As time has gone along, I’ve been wanting to set my sites a little higher. Automate some more. Perhaps learn to code some things, etc. But I’m not there yet.
If you have any ideas or suggestions on improvements that could be made, I’d love to hear more specifics about them. Feel free to post them here or to e-mail me.
Thanks,
Tanner