This topic came up recently and a number of well-respected fantasy experts discussed and debated the topic. I’m not here to rehash what they said, but hopefully to offer some points I didn’t see made in the discussions.
If you want to catch up on exactly what has previously been said:
- Peter Kreutzer (aka AskRotoMan) is running an interesting series on the top 10 most misunderstood fantasy baseball concepts. One of the first topics was the hitter/pitcher dollar value split. Part I, Part II
- Right around the same time, Enos Sarris (Rotographs), wrote his own post on the topic.
- I believe Sarris got the idea for the post from a Twitter conversation between Steve Gardner (USA Today Fantasy Sports), Christopher Liss (Rotowire), Mike Gianella (Baseball Prospectus Fantasy), and Jeff Erickson (Rotowire). You can see that conversation at this link (scroll up and down to see full conversation).
Before Twitter, we didn’t have this kind of access into theoretical discussions about fantasy baseball. It’s great to see this kind of back-and-forth and hashing out of ideas from a knowledgeable and respected group of fantasy writers. So what can I offer to this?
Cherry Picking
I will pull two specific tweets out of the discussion. Let’s start with this one from Kreutzer:
@MikeGianella @Chris_Liss @SteveAGardner @Jeff_Erickson Negative value in the auction AND undrafted value drives the split.
— Peter Kreutzer (@kroyte) January 13, 2014
A lot of explanations were thrown out to explain the popular 70-30 hitter allocation, but I think this makes the most sense. Kreutzer gives very specific figures in Part 1 of his explanation of this topic, and specifically mentions that the average return on investment for all hitters in expert leagues was 88% (or a loss of 12%). For pitchers the return was 32% (or a loss of 68%). Keep this in mind. We’ll come back to these figures later.
In Part 2 he discusses the concept of “free loot”, or valuable fantasy stats that were not drafted but find their way onto rosters in your league during the year.
Alright, I’m starting to understand the reason for hitters to be allocated more money. Why try to buy pitching stats during the draft if value from pitchers is difficult to predict accurately and if I can just wait until the season starts to pick up valuable players on from the free agent pool anyways.
But Is 70-30 “Correct”?
This is where the opinions in the various articles and within the Twitter conversation start to diverge. Within the items I linked to above you’ll see allocations mentioned for 70-30, 69-31, 67-33, 65-35, 60-40, and 59-41. So which is it?
Mike Gianella gets the closest to what I believe is the correct answer, but his point seemed to be lost in the shuffle of all the other tweets:
@Chris_Liss @SteveAGardner @Jeff_Erickson Ratios offers theoretical splits but the “correct” split is how your league allocates its dollars.
— Mike Gianella (@MikeGianella) January 13, 2014
It’s the “correct split is how your league allocates its dollars” portion I want to focus on.
Why Is This the Ideal Allocation? He Doesn’t Even Give A Specific Answer?
I’ll try to give you more actionable advice later, but I believe this to be the “ideal” allocation because fantasy baseball is not a game we play in isolation. It’s a huge experiment in game theory. You can’t decide the proper allocation without an understanding of what everyone else in your league is doing.
An Extreme Example To Illustrate the Point
Assume everyone in your league is evenly distributed between a 60-40 allocation and a 70-30 allocation (e.g. someone is 61-39, 62-38, etc.). You have just bought the most amazing data analysis software of all time. You import all the auction results in the history of fantasy baseball into your fancy software and it tells you the optimal allocation is 85-15.
What do you do?
I Don’t Care If Nate Silver Himself Calculated this 85-15 ratio…
You don’t use it if everyone else is maxed out at 70-30.
Put yourself back in your last microeconomics class. If imagining that didn’t just cause a brain hemorrhage, hopefully you can recall that businesses can maximize their profits through marginal analysis or marginal decision making.
For a business, a marginal line of thinking might be, “How much can I sell this one additional widget for?” and “How much will it cost me to make?”. If you can sell that next widget for more than it costs you to produce, you make another one. And you keep making more until the marginal gain (what you can sell it for) equals the marginal cost (what it will cost to make).
Things are not so clear cut in fantasy baseball, but we have to be able to apply these same marginal principles. For each additional dollar I allocate to hitting, how much do I gain in the hitting standings? For each additional dollar I pull out of pitching, how much do I lose in the pitching standings?
Let’s make one more giant assumption in our auction example from above. Assume everyone is using the exact same set of projections and value formulas, but they will be spending their money in the different hitter-pitcher allocations. This is a crazy assumption, but I need it to demonstrate the point that if you spend $171 on hitting that you will finish higher in the hitting categories than someone who spends $170.
We have already established that every other team in the league is evenly spread from 60-40 allocation to 70-30 and that some witch doctor told you 85-15 is the ideal allocation.
If you push your actual allocation to 85-15 you would lose the league. This despite being told that 85-15 is the “ideal” allocation. The reason being this whole marginal gain and marginal cost thing.
Every dollar you spend on hitting is a dollar you cannot spend on pitching. And once you move past the 70-30 allocation, your seventy-first percent gets you no added benefit in the hitting standings. You theoretically will have won all the hitting categories (again, assuming we’re all using the same projections and dollar values, etc.). But because you can’t spend those extra dollars on pitching (you’re spending more on hitting which means even less for pitching), you actually cost yourself points in the pitching categories. And as you push further toward the 85-15 allocation, every increase in hitting spending results in no benefit but continues to subtract from your pitching statistics.
I Told You I Had Practical Advice…
I need to give a disclaimer before this next part. I’m not a mathematician. And while the math that follows may not be 100% sound, the point it demonstrates is true. If I have made serious flaws in the analysis that follow, unleash your fury on me in the comments after this post.
I’m going to continue with this same example but reintroduce two pieces of information from Peter Kreutzer’s article: The average return for each dollar spent on hitters in 2013 expert leagues was $0.88 and for pitchers the return on each dollar was $0.32. I will assume that is a constant variable for this example (knowing full well that is a bad assumption).
How Can We Determine The Benefit Of Spending One More Dollar On Hitting?
The best way (I can figure) to determine the value of more spending on hitting is to account for the number of teams you have outspent on hitting and the number of teams you have underspent. In a 12-team league there are 11 other teams you can outspend or underspend. When you outspend a team in hitting dollars (and theoretically buy more hitting stats than them), that is one less team you can pass in the standings. Additional spending can only help you gain or pass the other 10 teams. This trend continues for each additional team you outspend.
For every team you outspend your marginal benefit decreases.
More specifically, for each team you outspend (in hitting or pitching), your projected return drops by 1/11th (or 1/(n-1), where n is the number of teams in the league).
While the first dollar I spend more than the team with the lowest hitting investment will is still expected to have a raw return of $0.88, those $0.88 of value are 1/11th less valuable to me.
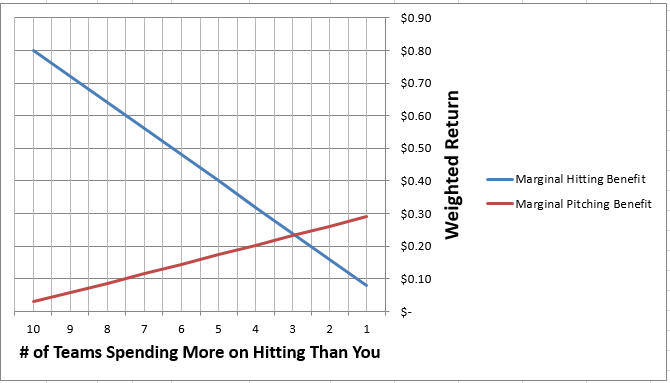
To account for this, I’ll multiply the $0.88 expected return by 10/11 for a weighted value of $0.80. As I pass another team and weight that $0.88 return by 9/11 it yields $0.72. And so on (see chart below).
We can do the same for the $0.32 expected return on pitching. If you’ve spent the least on pitching you would expect to gain $0.32 of value for each additional dollar. As you pass the first team, spending more on pitching becomes 1/11th less valuable. So the $0.32 of value can be weighted to about $0.29 of value, and so on (see chart below).
Optimizing
Recall that the optimal allocation is the point at which added benefits equal added costs (or the point at which the lines cross in the graph below). In our graph, this is at about the point where you have outspent 8 teams (or 3 have outspent you) in hitting and outspent only 3 teams (or 8 have outspent you) in pitching.
This Example Is Oversimplified
I can’t argue with this. But the takeaway is important. The more opponents you outspend, the less beneficial it is to continue to pour money into hitting and the more beneficial it becomes to allocate money to pitching.
We don’t all have the same set of projections. We don’t use the same dollar values as everyone in the league. More accurate projections and better formulated dollar values are certainly a way to gain an advantage. But optimizing your allocation between hitting and pitching is too.
I also assumed a constant return on investment of $0.88 for hitting and $0.32 for pitching. However, Kreutzer points out that when you break hitters and pitchers into smaller subsets, like all players that cost more than $20, the return for pitchers is actually higher than hitters. This is the benefit of disaggregating data I wrote about recently.
The Bottom Line
This was hard to write. And probably even harder to follow my line of thinking. But if you walk away from this post with one thing, let it be that pursuit of an ideal percentage allocation between hitting and pitching might be wasted effort. Your time may be better spent identifying the optimal place to position your allocation within the context of the rest of the league (what everyone else is doing).
The 88% hitting return and 32% pitching return likely fluctuate from year-to-year, and we need to better understand if higher dollar pitchers can consistently return more than higher dollar hitters, but if hitting continues to return a higher value than pitching, it seems optimal to be in the top half of hitting spending and in the bottom half of pitching spending.
Thanks for Reading
Stay smart.



I enjoyed this article (as well as many others you have written). I only participate in a 10 team 5×5 roto keeper league that uses a snake draft. However, I often use sites to try and create my player values and cheat sheets that ask for my hitter/pitcher $ split. Would this matter much in that case? Should I set hitting at $68 and not worry much about it? Thanks!
Ryan, you’re probably safe to choose a middle-of-the-road split and not worry too much about it. But you could do some kind of retrospective analysis of past years. You could use a website and run three different player values. One for 60-40, one 65-35, and one 70-30. Then see how the pitchers come out in those different scenarios (what rounds/draft pick do they come out with). Then compare those three scenarios to recent draft history in your league.
You could break down recent draft history by summarizing the number of pitchers selected in each round. For example, one pitcher in the first round, one in the second round, three in the third, etc. See how that lines up with the different player values created for this year.
It’s not precise. But I’m struggling to come up with a better alternative. If pitchers are coming out as better players in actual recent draft history, then you could consider trending toward the 60-40 allocation.
But keep in mind what Peter (Kroyte) says below. If you are allowed to trade, if you’re active during the season, and if you believe you can acquire pitching effectively during the year, then don’t be afraid to go with 70-30 or even higher. And then trade as necessary or focus your efforts on acquiring pitchers during the year.
Hi. That’s an interesting take on the issue. What I certainly agree about is that Gianella’s comment about what matters is what your league does. The reason we talk about the split is because your league will break somewhere near it. If you know where you can adjust your values to best reflect the real budgets of opposing teams. That’s edge No. 1.
Then, as Tanner works out, you can try to figure out how much you should spend on hitting and how much on pitching. This doesn’t have to split the same as your league, though it can. But you can gain an edge by deviating.
The only issue I have with Tanner’s methodology of determining the best strategy, because I agree with his conclusion, is that I don’t think his model reflects the true capability we have of maximizing our rosters by trading. I think you can spend more on offense than any other team for offense, and regain marginal value by swapping excess offense for pitching. So it’s more important to chase value wherever you find it, if your league trades, than slot how much you spend versus your leaguemates.
If your league doesn’t trade you have to be more aware of overbuying in any given category.
Thanks for taking the time to comment, Peter. I very much agree with your criticism that this doesn’t take into account many of the other in-season options we have for acquiring value. The analysis above is so abstract/conceptual and loaded with assumptions that don’t hold up in the real world, that it doesn’t offer a ton of practical value. But hopefully the exercise is worth thinking about.
My best theory is that each individual player likely has their own “ideal allocation” that we can only identify by looking in the mirror. We can guess that the ideal allocation is 70-30, but we should be taking a deep look at our own draft history and player acquisition tendencies, and calculating our own “return on investments”. While the return on investment for hitters in an expert league might be 88%, I might have my own track record above or below that. Maybe I’m better at identifying pitchers than 32%.
Further, maybe I’ve proven to be very good at acquiring hitter “free loot” during the season and poor at pitcher “free loot”. This might be due to personal tendencies, biases, or lack of knowledge.
I have just found the site, and am glad to be able to have these convsersations with someone OUTSIDE my league!
I play a very deep NL Roto Keeper league (23 active 14 hitters/9 pitchers both SP and RP and 15 ultra draft bench spots). My league tends to overpay for superstars and for offensives ones even more so. Because of this slant, somtimes extrememly solid pitchers go for good value.
For example, when I knew I was not going to win my league (in 2014), I traded for a $9 Jordan Zimmerman, and then got Zack Greinke ($17) and Ian Kennedy ($1), in a package, to go along with my $8 Tyson Ross. Jhenry Mejia is my final keeper at $2.
In my opinion, that is a lot of pitching for an average of $7.4 bucks a head. Since I think that they will produce at a much higher value than thatcost, I am going with an 80/20 split favoring the offense. I am going this route for the frist time, because I already think I have that extra 10% wrapped up with the dollar cost average mentioned above. I’ll have $15 bucks to fill 4 RP, hopefully a closer is one of them. We do H as well, so $1 relievers are not uncommon.
In closing, I have wondered about the “right” split for many years all to find out there might not be one.
The misconception about the split is that every team should go for a 70/30 split. That isn’t true. Your example is a good one for why you should spend more on hitting this year. Still, when your auction is done, the split for the league as a whole should be around 70 percent of the budget on hitting, 30 percent on pitching. And that’s useful information, if true, or if for some reason your league is different, it isn’t.
Hi Drew, I agree that increasing your allocation as a mechanism to help you acquire more hitting makes sense in your current situation. 80-20 might be overly dramatic if no one else has pushed their allocation much past 70. So you might consider running you values at a few different levels (e.g. 80/20, 75/25, 70/30). Then as the draft unfolds monitor the prices others are using and you’ll have an idea of what split the rest of the league is utilizing. Then you can ratchet down your allocation so it’s only slightly above the rest of the league.
I say this because if you’re far and away the highest percentage EVERY hitter that comes up will seem like a bargain at your prices and you will never win a pitcher.
I belong to a 12 team A L only league, auction we have $ 300 to spend , I try to spend $200 on hitting and $100 on pitching,