In this post I’ll show you how you can take a boring black and white spreadsheet and convert it into a visually meaningful piece of art in less than 10 minutes.
An important factor in being a skilled drafter is the ability to remain cool and calm in pressure situations. There may also be opportunities to intimidate some of your opponents during the draft, to give them the impression that you are highly prepared and ultimately familiar with the player pool and your own drafting strategy.
Nothing can accomplish these things better than a fancy color-coded spreadsheet.
There may be an element of hyperbole in that statement. But we have all been there. It’s late in the draft, you’ve already wasted 60 of your 90 second allotted time and you’ve just made the decision that you need to draft a second basemen with some power but that won’t kill you in batting average. Or you need a pitcher with good strikeout totals that won’t kill you in WHIP. Or some obscure shortstop is thrown out for bid in the auction and you can’t remember if he will help you with reaching your target goal in stolen bases.
Enter Conditional Formatting in Excel
Conditional Formatting in Excel allows you to give visual meaning to a mass of boring looking numbers that can be hard to interpret all at once. Let’s face it, while looking at the spreadsheet example in the image below it is not easy to quickly make sense of the numbers.
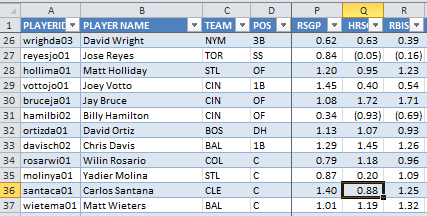
But if I take this same area and apply a few of the different conditional formatting rules to it, you can much more quickly make sense of what you are seeing:
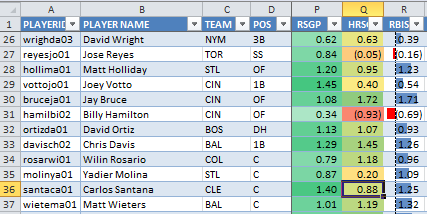
In the “RSGP” column I have applied a rule in which you select two colors. One color represents the highest value in the data selected and the other color represents the lowest value in the data selected. I chose a standard green color for the highest value and white for the lowest. Excel then automatically provides shades between white and green to each player’s “RSGP” based upon its value relative to all the other players in the list. Whether you agree with me or not, I’m down on Billy Hamilton’s ability to stick at lead off for the entire year, and his run projection is the lowest of anyone captured in the screenshot. So he’s the closest to white. While Votto has the highest “RSGP” in this small group of players, so he’s shaded closest to green.
The “HRSGP” column has a rule using three colors. Green is still used for the values that are greatest in this column. Red is used for the lowest values, And Yellow is used for values near the 50th percentile of the group. Again, Excel automatically shades ever player’s value according to this set of instructions. You simply select the three colors and Excel does the rest. Here you can see Billy Hamilton is projected to be very low in “HRSGP”, while Jay Bruce and Chris Davis are much higher. These two illustrate an important concept too. I have Bruce projected to hit fewer home runs than Chris Davis, but Bruce comes out with a higher “HRSGP” based upon the positional replacement level adjustment under the SGP method.
The “RBISGP” is using data bars to depict the value of each player’s RBI compared to the group. Not to keep piling on Billy Hamilton’s lack of hitting prowess, but you see he has a red bar pointing to the left, in his “RBISGP” column. This indicates the magnitude to which his RBI projections are below 0.00 SGP. Jay Bruce, right above him, has a very strong RBI projection and a blue shaded bar depicts this.
![]()
This Seems Way Too Complicated
It’s really not. You can add this to your draft spreadsheet in under 10 minutes.
Things To Consider Before We Start
In the step-by-step instructions below, I apply conditional formatting to a player’s standings gain point (SGP) figure for each individual category (e.g. HR, BA, R, etc). I choose to do this because after following the “Create Your Own Fantasy Baseball Rankings” approach, the final SGP figure for any player includes an adjustment for replacement level at the position. This means that 15 HR from a 2B are valued more than 15 HR from a 1B.
The other benefit of applying the formatting to the SGP columns is that rate states like BA, ERA, and WHIP will be weighted appropriately. An OF that might hit .300 but only get 200 PAs isn’t really helpful to our team BA.
There is an argument to be made that you would want to apply conditional formatting to a player’s raw statistics instead of the SGP figure. After all, if you’re trying to draft players in order to reach a targeted goal (like 250 HR), you might be more interested in a 1B projected to hit 18 than the C projected for 17, even though those 17 from the C are more “valuable”.
Anyways, that’s beyond the scope of this post. I’m just here to add fancy colors to your spreadsheet right now. Just know that you can do this using a player’s raw projections even if you haven’t worked through the “Create Your Own Fantasy Baseball Rankings” series.
Step-By-Step Instructions
| Step | Procedures |
|---|---|
| 1. | First, you must have a spreadsheet full of projections data. If you have worked through the “Create Your Own Fantasy Baseball Rankings” series, we will apply the formatting to the “Hitter Ranks” and “Pitcher Ranks” tab.If you have not done this, you get a lot of really good projection information in Excel downloads at Fangraphs.com or FantasyPros.com. Both of those sites have the option to download or export the projections to CSV (which opens easily in Excel) or Excel file formats. |
| 2. | Calculate the number of hitters and pitchers that will be drafted in your league.
For example, if you are in a 12-team league in which each team drafts 14 hitters, you will have 168 hitters drafted (12 * 14). |
| 3. | 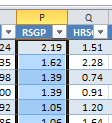 We will first apply formatting to the “RSGP” column in your hitter projections. To do this, click and drag with your mouse to begin selecting amounts in this “RSGP” column.Don’t select the header “RSGP” (or “R”). Just select the data. We will first apply formatting to the “RSGP” column in your hitter projections. To do this, click and drag with your mouse to begin selecting amounts in this “RSGP” column.Don’t select the header “RSGP” (or “R”). Just select the data.
Only select amounts for the pool of draftable hitters. Don’t select every amount in the column. For example, if you calculated that your league will draft 168 hitters, select the “RSGP” figures for those top 168 hitters. Don’t select the “RSGP” figures for hitters 169 and above. |
| 3. | 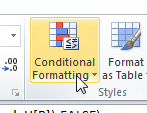 On the “Home” tab of the Microsoft Excel Ribbon, select the “Conditional Formatting” button. On the “Home” tab of the Microsoft Excel Ribbon, select the “Conditional Formatting” button. |
| 4. | In the submenu that appears, select “Color Scales”. You can then choose from the standard options Excel gives.If you like the two-color (green and white) example I gave above for “RSGP”, select the icon shown below (the icon in the lower left).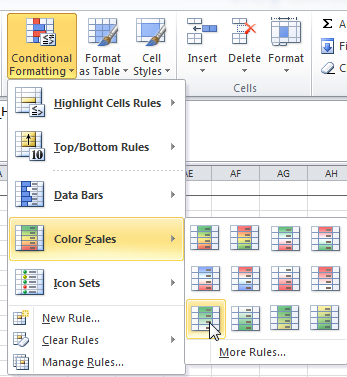 If you like the three-color (green, yellow, and red) example I gave above for “HRSGP”, select the icon shown below (top left). If you like the three-color (green, yellow, and red) example I gave above for “HRSGP”, select the icon shown below (top left).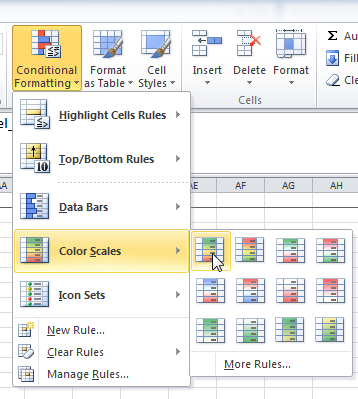
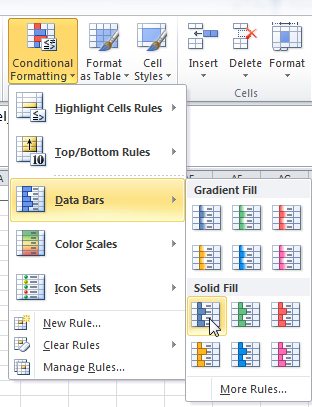
If you like the data bar example I gave above for “RBISGP”, move your mouse to the “Data Bars” submenu. Then select the icon shown below (top left under “Solid Fill).
|
| 5. | Repeat steps 3 and 4 for each standings category (R, HR, RBI, BA, SB, W, K, SV, ERA, WHIP). Simply select each standings category ONE AT A TIME and apply your favorite formatting rule. That’s it! |
I Told You It Wouldn’t Take Long
These formatting options will make your life much easier as the draft clock ticks down or if the auctioneer starts saying, “Going once…”.
And they look bad ass too.
Thanks For Reading
Stay smart.
Is there a way to incorporate multiple positions for a player? Take Ben Zobrist for example. In my league he qualifies at 2B, SS, and OF. He is only listed as a 2B in these spreadsheets though. So if I sort my rankings by SS on the spreadsheet he isn’t listed, but I would like him to be.
Also, how would calculate his TTLSGP since the replacement level SGP varies by position?
This is an interesting topic. I may write a more in depth post about it soon. But my short answer is that you have two options. Neither is perfect.
Option 1: Add a new column that would represent “Position Eligibility In Your League”. You could put a value like 2B/SS/OF for Zobrist. Leave the main “POS” column as it is and don’t change any of your calculations. This new column is just for you to use for filtering/sorting during the draft.
I don’t think adjusting the formulas for TTLSGP is necessary. I would just classify each multi-positional player at the position with the weakest replacement level. For the most part, multi-positional players get used at an obvious location. Mauer is a C, nobody is going to draft him as a 1B. For guys like Zobrist and Prado, the adjustment for a 2B is not that different than for that of an OF. So it’s not worth splitting hairs over.
Option 2: This option has some pitfalls in it, but you could work around them. But you might try having Zobrist listed in the “Rankings” sheet three times, once for each position he qualifies for. If you’re marking him as drafted, you would have to do this three times. That could be a pain to deal with.
And the other issue I see is that you only want to include one Zobrist in your determination of replacement level. If you say 18 SS will be drafted, then the 18th SS is your replacement level player. If you say 66 OF will be drafted, then the 66th OF is your replacement level player. But if Zobrist appears in both lists, you don’t count him twice. I think you’d use the 67th OF as your replacement, if you go this route.
If you do go this route, your TTLSGP would be different for Zobrist the SS than for Zobrist the 2B than for Zobrist the OF. Each version of Zobrist would be compared to replacement level at that specific position.
Thanks for the timely response. Both options are good suggestions. I think I will go with option 1 and add a new column for filtering/sorting purposes.
Great guide and easy-to-follow instructions. Ordering the SFBB projections bundle today to personalize my rankings even further!
Hi Tanner – Thanks so much for these great posts. They have been so helpful! I just finished reading Larry Schechter’s book “Winning Fantasy Baseball” and your posts help to operationalize many of his strategies. I do have a utility question for the usefulness of this sheet in a draft… While using this sheet in a draft, it would be awesome to be able to click on a name of a player that has been drafted in order to “hide” him from view so that only those available players are visible. Do you know how to accomplish that?
Hi Joe, thanks for the kind words. I think this post can help you do what you’re talking about: https://www.smartfantasybaseball.com/2014/01/how-to-track-drafted-players-in-a-spreadsheet/
You are da man. I started reading your new blog posts about 2 weeks ago… Guess I could have just searched your site. :) THANK YOU!
No problem at all. These kinds of questions are helpful to me, so if you have more “draft spreadsheet” questions, don’t hesitate to ask.
I need to think about how to better organize the site. But in the meantime, anything Excel-related should be here, most recent posts first.