Picking up where we left off in the post “Use PITCH f/x Data to Identify Potential Breakout Pitchers“, now that we’ve identified the potential pitchers (link to pitchers with differences) who have added a new pitch or that have significantly adjusted their pitch usage mix in 2013, we need to determine if the new or more heavily used pitch is successful.
Before We Go Any Further
I think it’s important you read the article The Internet Cried A Little When You Wrote That On It, by Mike Fast (follow Mike on Twitter). The whole article will be helpful if you’re trying to improve you understanding of PITCH f/x, but at least read bullet #1.
My takeaway from that piece is that significant changes in pitch mix, especially within the fastball classifications (FA, FT, FC, FS, SI), are most likely to be changes in the algorithm used to classify the pitch.
Take for instance, Jake Peavy. The PITCH f/x data I downloaded from Fangraphs and manipulated to identify “potentially” new pitches, shows the following for Peavy:
![]()
Interpreting that chart, from 2012 to 2013, the Fangraphs data shows a decrease in the fastball (FA) of 19.9% and increase in the two-seam fastball (FT) of 26.7%. That sounds interesting on the surface, no? Decrease one pitch 20% and increase another?
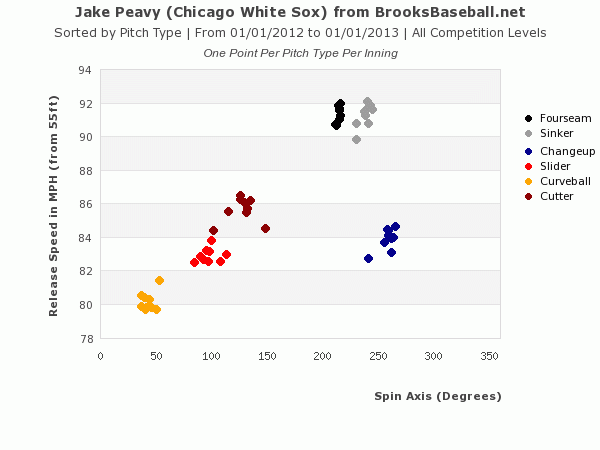
From Mike Fast’s article we know that we can’t necessarily trust the pitch classifications. So let’s look at the 2012 velocity and spin on Peavy’s pitches:
And the same for 2013:
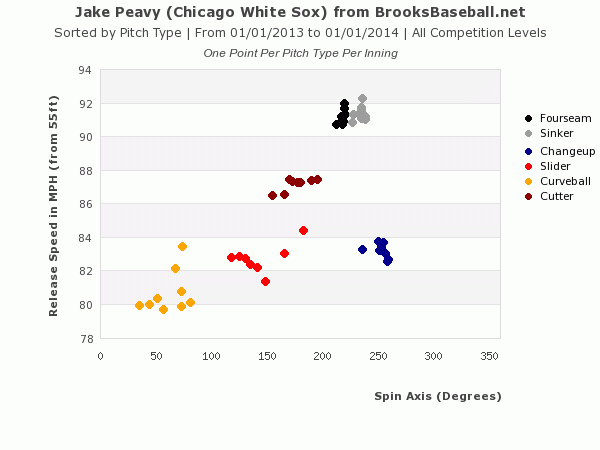
From these two charts you can see Peavy’s throwing the same pitches in 2013 that he was throwing in 2012. The clusters are in the same general vicinity on the chart. But more importantly, you can see there is very little difference between the fourseam (FA) and the sinker (BrooksBaseball calls the two-seam fastball a sinker (FT)). So a 20% transfer from one classification to another is likely a change in the algorithm, as we were warned.
Give Me Someone Else to Look At
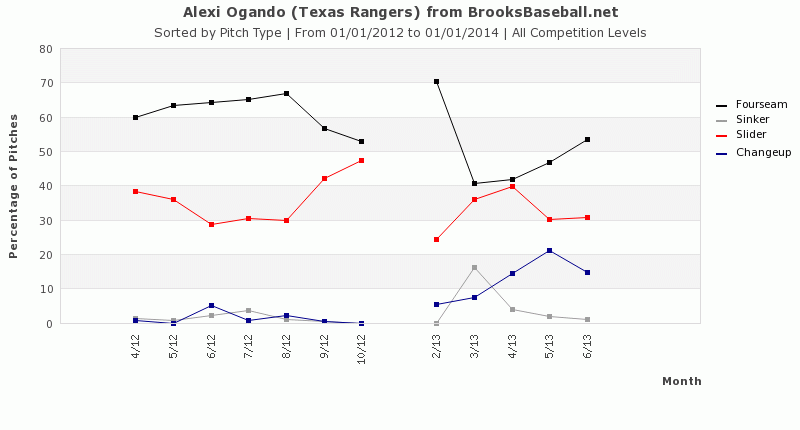
Alright, Alexi Ogando, although injured recently, has been intriguing. The raw data shows a sharp decline in fastball usage and an increase in the changeup. This probably isn’t just a case of an algorithm change (fastballs wouldn’t likely be misclassified as changeups).
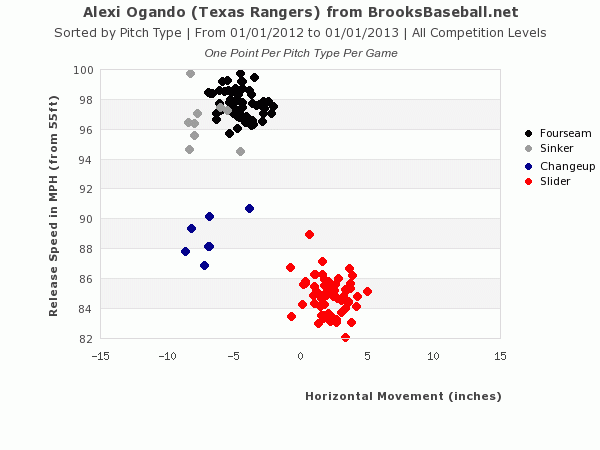
Let’s look at his 2012:
And in 2013:
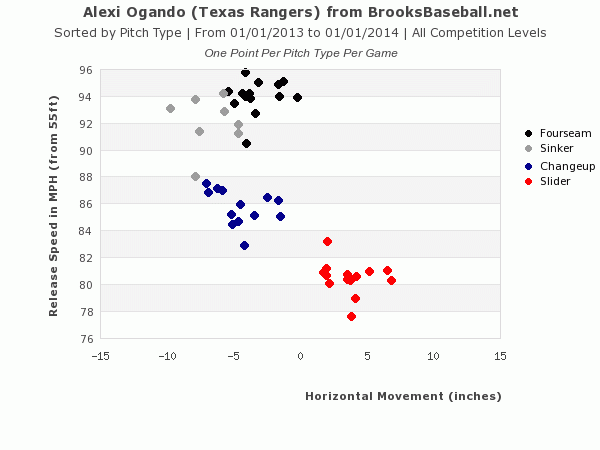
It does look like Ogando has suffered from a decline in velocity. But the Fangraphs usage data indicated a big change in usage of the Changeup. Let’s see if BrooksBaseball, which performs their own classifications, agrees.
Alright. It does take a bit of research and reviewing of graphs, but we have confirmed that the changeup does not appear to be confused for other pitches and the classifications at BrooksBaseball confirm the Fangraphs data (the purple line is up markedly from 2012).
So He’s Throwing The Changeup More. But Is It Working?
Nobody said this was easy. But it’ll be worth it when you’re the first to uncover the hidden pitching gems.
Looking at the tables below, the changeup is not used as a strikeout pitch (just 3 in the 41 at bats that ended with the changeup). But when put into play, it’s only sporting a .146 BA and .195 SLG, as well as a 63% ground ball rate. Further, while it has not generated a lot of strikeouts, the Whiff/Swing shows it has some potential (28.7%, second only to Ogando’s slider).
Conclusion
Ogando has really developed the changeup to become a legitimate pitch. He has gone from using it only sparingly in 2012 to over 15% of the time in recent months. The pitch isn’t generating a lot of strikeouts at this point, but it appears to have potential. Further, when it is put into play, hitters are not doing any damage. The changeup is drawing a lot of ground balls and has not been hit for a HR yet.
What do you think? There’s a lot to pitch analysis. But it seems like a promising tool that can be used to identify potential breakouts or to legitimize a pitcher who is off to a hot start (and not necessarily due for “regression”).
Thanks for reading. Stay smart.

