Use PITCH f/x Data To Identify Potential Breakout Pitchers (Part III)

If you’ve made it to Part III in the search to identify potential breakout pitchers, congratulations.  If you missed them, you can find Part I here and Part II here.

Enough Talk, Where Is This List Of Potential Breakout Pitchers?

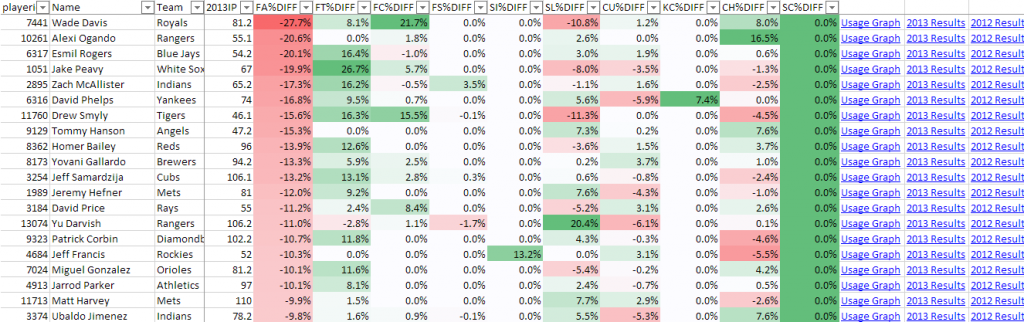
I’ve uploaded an Excel file to Microsoft Sky Drive.  You can edit, view, or download the file for your own uses.  It’s mostly the same data from the YouTube video, but I added a lot of bells and whistles.  A red cell indicates a pitch that has declined in use from 2012 to 2013.  A green cell indicates a pitch with more usage.  The color intensity indicates the magnitude of the change.  The links to the right take you directly to that specific player’s page on BrooksBaseball.net.

PitchClass14
Click on the image to be taken to the editable file (you can edit or download for your own use).

Disclaimer #1

Keep in mind, I started this analysis on June 24th, 2013.  So if you’re finding this information after that time, you may want to double-check the usage graphs for any pitcher you’re researching.  But I’ve tried to document the approach to doing this research in the video and other parts of this series.  You can perform this research at any time (it would be great if we could get monthly usage reports from Fangraphs, then we could do this in the offseason to identify pitchers who started to change their mix late in the season).

Disclaimer #2

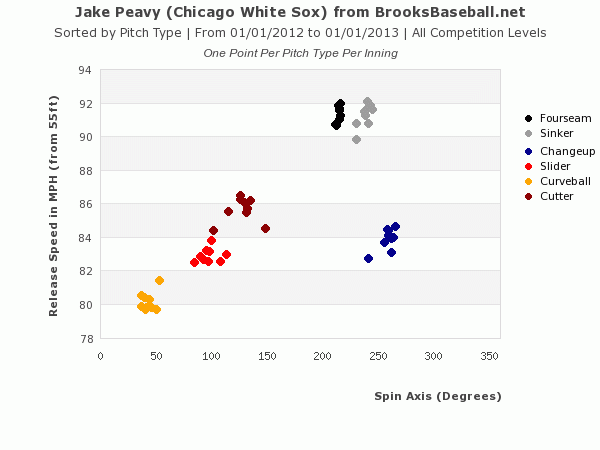
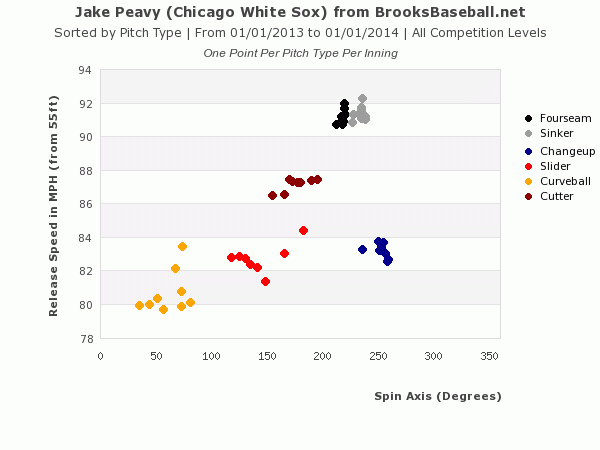
You saw from Part II of this series that these changes in mix have to be taken with a grain of salt.  And even after you’ve verified that there is indeed a change in pitch mix, you still need to go review the effectiveness of the pitches being used more frequently.  I wish I could go through each of these pitchers and break them down for you.  But it’s just not practical (my two-year old and four-year old don’t find PITCH f/x research very entertaining).  Hopefully I’ve equipped you with the tools you need to go analyze these pitchers more closely.

For pitchers on your team, check them out.  If you’re thinking of picking up a free agent, check him out.  If your pitching staff is terrible and you need to find the next big ace, check them all out.

Conclusion

Granted, it’s a small sample size.  But I’ve done a deep look in this fashion for Edward Mujica, Max Scherzer, and Alexi Ogando.  And all show promising results.  There will certainly be pitchers that change their mix and it has little effect on their end results.  But this seems like a promising exercise.

PLEASE LET ME KNOW WHAT YOU THINK Or If You Have Questions

I realize this is quite involved.  It’s certainly more difficult than reading the weekly pickups columns that are out there.  But anyone can read those and snag players just as easily as you can.  This process will put you ahead of the curve, give you players to monitor, and give you first crack at picking them up.

Thanks and be smart.


Use PITCH f/x Data To Identify Potential Breakout Pitchers (Part II)

Picking up where we left off in the post “Use PITCH f/x Data to Identify Potential Breakout Pitchers“, now that we’ve identified the potential pitchers (link to pitchers with differences) who have added a new pitch or that have significantly adjusted their pitch usage mix in 2013, we need to determine if the new or more heavily used pitch is successful.

Before We Go Any Further

I think it’s important you read the article The Internet Cried A Little When You Wrote That On It, by Mike Fast (follow Mike on Twitter).  The whole article will be helpful if you’re trying to improve you understanding of PITCH f/x, but at least read bullet #1.

My takeaway from that piece is that significant changes in pitch mix, especially within the fastball classifications (FA, FT, FC, FS, SI), are most likely to be changes in the algorithm used to classify the pitch.

Take for instance, Jake Peavy.  The PITCH f/x data I downloaded from Fangraphs and manipulated to identify “potentially” new pitches, shows the following for Peavy:

PitchClass2

Interpreting that chart, from 2012 to 2013, the Fangraphs data shows a decrease in the fastball (FA) of 19.9% and increase in the two-seam fastball (FT) of 26.7%.  That sounds interesting on the surface, no?  Decrease one pitch 20% and increase another?

From Mike Fast’s article we know that we can’t necessarily trust the pitch classifications.  So let’s look at the 2012 velocity and spin on Peavy’s pitches:

PitchClass4
Click image to be taken to this page at BrooksBaseball.net

And the same for 2013:

PitchClass3
Click image to be taken to this page at BrooksBaseball.net

From these two charts you can see Peavy’s throwing the same pitches in 2013 that he was throwing in 2012.  The clusters are in the same general vicinity on the chart.  But more importantly, you can see there is very little difference between the fourseam (FA) and the sinker (BrooksBaseball calls the two-seam fastball a sinker (FT)).     So a 20% transfer from one classification to another is likely a change in the algorithm, as we were warned.

Give Me Someone Else to Look At

Alright, Alexi Ogando, although injured recently, has been intriguing.  The raw data shows a sharp decline in fastball usage and an increase in the changeup.  This probably isn’t just a case of an algorithm change (fastballs wouldn’t likely be misclassified as changeups).

PitchClass10

Let’s look at his 2012: Continue reading “Use PITCH f/x Data To Identify Potential Breakout Pitchers (Part II)”

Video: Use PITCH f/x Data To Identify Potential Breakout Pitchers (Part I)

I’ve talked before about the amazing tool we have at our fingertips in PITCH f/x.  I’ve also had two (Scherzer and Mujica) instances this season where I came across seemingly small anecdotes about a specific pitcher adding a new pitch, and the pitcher in question has gone on to have a “breakout” season thus far.  So I thought to myself…

Why Not Look For More Pitchers Who’ve Added A New Pitch

And rather than just share the results with you, I thought it might be more beneficial to share the method I used to do my search.  You know, the whole “teach a man to fish” proverb.

While there is a lot of great PITCH f/x data available at sites like Fangraphs and BrooksBaseball.net, I have not been able to locate a resource that allows me to do a year-to-year comparison of the data across a large pool of players (BrooksBaseball can show you great comparisons for a specific player).  So to identify these pitchers who have developed a new pitch, I had to download sets of data for 2012 and 2013 and apply some functions in Microsoft Excel.

I recognize that some of my posts get a bit lengthy and this process may have pushed the limits, so I’m trying something new and have put together my first YouTube video (if you’re interested in being notified of future videos, click here to subscribe to the SFBB YouTube channel).

About The Video

The video is approximately 15 minutes long, and takes you through a step-by-step process to download PITCH f/x pitch usage data from Fangraphs.com, pull the data into Excel, match up 2012 and 2013 pitch usages, calculate a difference in pitch usage, use the calculated difference to target players that are most likely throwing a new pitch in 2013, and how to use BrooksBaseball.net to conduct further research on individual pitchers.

Coming Soon

I’ll polish up the results and post an Excel file, containing pitchers to keep an eye on, for you to analyze.

Thanks for reading… and watching.  Stay smart.

A Deep Look Into Hitter Strikeout Rate (K%)

Read any fantasy baseball analysis and you’re bound to encounter the hitter strikeout rate (or K-percentage) statistic.  “Player A’s strikeout rate has increased from 18% last year to 22% so far this year”.  I understand K-percentage is, it’s not complicated to calculate.  But I’ve never been able to locate a good explanation of why strikeout rate is inherently bad or what it indicates.  So I set out to answer some of these questions.

My goal in this post is to take a deep look into what strikeout rate is and what effect it has on batting average.  If you’re not much for reading, skip to the spreadsheet illustrating the effect of strikeout rate on batting average.

What Is Strikeout Rate?

This is simply the percentage of plate appearances that result in a strikeout.  Fangraphs has a good, brief discussion of the statistic and what represents an Awful-to-Excellent rate.

Strikeout Rate = Strikeouts / Plate Appearances

What Does This Mean? Why Do We Care?

After quite a bit of scouring the internet, I am still unable to locate anything more than the basic definition of the term strikeout rate (if you know of a great explanation, please leave a comment or Tweet me the link).  The Fangraphs article mentions the more a player strikes out, the more difficult it is to maintain a high batting average, but it’s short on specifics.  I found a nice article at Beyond the Box Score about how to predict strikeout rate.  But that seems like a pointless exercise until I understand more about the statistic (why predict something I don’t fully understand!).

Since I can’t find a great resource, I’m left to speculate and make an educated guess.  It’s pretty clear that a strikeout is a missed opportunity to put the ball in play.  It’s certainly an out.  So it inherently is detrimental to a players batting average (the ball is not put into play, so the AB cannot result in a hit).  Further, it can’t lead to a run, HR, or RBI.

While we know it’s bad for batting average, it’s very important to keep in mind that there is also a trade off.  Watch enough baseball and you know that striking out is related to power.  And it’s been proven that this is the case.  So we know that striking out negatively affects batting average, but it is positively related to hitting for power.  Meaning there’s likely some point at which you could optimize a hitters ability to hit for average and still hit for power.  That seems like a different article for a different day.

The Effect On Batting Average

How much does strikeout rate affect batting average?   Continue reading “A Deep Look Into Hitter Strikeout Rate (K%)”

Book Review – ‘The Extra 2%’ by Jonah Keri

In addition to my typical fantasy and regular baseball readings around the web, I have decided to start reading books that I think can help build my analysis skills and baseball knowledge.  Afterwards, I’ll give a review of the book and apply some takeaways.

Leading Off

The book I chose to read first is The Extra 2%:  How Wall Street Strategies Took a Major League Baseball Team from Worst to First. I chose the book for two main reasons:

  1. I’m a fan of Jonah Keri’s work elsewhere on the web.
  2. The title screams to me that there are surely strategies and mindsets that can be borrowed from the book and applied to fantasy baseball.

About the Author

I first became aware of Jonah Keri when I stumbled upon his podcast a couple years back.  Unfortunately he no longer produces new episodes, but I found him smart and entertaining, and he had great baseball guests like Rickey Henderson, Rob Neyer, and R.A. Dickey on the show.  Jonah has since made it big, appearing on Baseball Tonight occasionally and writing regularly for Grantland.com.

Please note that I only recommend resources that I think are extremely valuable and that I use myself.  The link to The Extra 2% above are affiliate links, through which I earn a small commission if you were to purchase the book. The book will cost you the same if you directly go to Amazon and search for it or if you click an affiliate link. Think of this as a small way to support the site if you find SmartFantasyBaseball valuable.  Or if you prefer a generic link through which I receive no benefit, use this.

The Extra 2%

The backdrop of the book is a look into the history of the Tampa Bay Rays franchise, from the beginning battles the Tampa area fought to win a team to the inception of the franchise, its initial struggles, and then an ownership change in 2005 that gave the team  new life. On top of that historical account of the Rays franchise, Keri highlights the strategic and analytical approach the new leadership team brought with it in 2005.  As the title of the book indicates, the Rays turned to a team of Wall Street experienced businessmen and analysts with little or no formal baseball experience.  But it was the analytical and value-driven approaches learned on Wall Street that helped the Rays turn things around.

How They Did It

The book is full of specific stories and examples of how the Rays went about this transformation and the decisions they made.  From the stories, I observed three main themes the team applied to improve the Rays organization (and that you could apply to become a smarter fantasy baseball mind):

Young Players and Your Push For the Championship

Up until now, I’ve been led to believe that the reason Wil Myers hasn’t been called up to play for the Tampa Bay Rays is simply because of service time concerns and an attempt to maximize the Rays’ control of Myers before he can become a free agent (delaying a call up until after a certain point of the season may allow a team one more year of control over a player before free agency).

I’ve even heard it said that it seems like the Rays are willing to sacrifice an opportunity to win now, while they still have David Price (who will be a free agent after the season), just to get this extra year of service out of Myers.

But maybe It’s not Really About Service Time

On the June 12th edition of his Baseball Tonight podcast, Buster Olney interviewed Rays GM Andrew Friedman about Wil Myers’ development and the range of time when Myers’ could be called up, and here’s an excerpt of the response (the Friedman interview starts at about the 24 minute mark, the comments on Myers are around 33:40):

As much as we can continue that development while he’s there (in the minors) and not affecting us as we’re trying to win games is good. And that goes for any young player, I think. While we’re competitive it’s a little bit different in how we view our young players, and if we weren’t competitive we’d probably bring them up a little bit earlier. But it’s challenging in that we can’t just bring them up to the major league level to let them finish their development. ~ Andrew Friedman – General Manager, Tampa Bay Rays

Continue reading “Young Players and Your Push For the Championship”

Does It Make Sense To Carry Three Catchers?

ThreeCatchers1
Yahoo! Games Played Tracker does a great job of projecting your games played by position

I play in a couple mixed leagues that use the standard rotisserie lineup configuration (if there is such a “standard” any longer) of 2 C, 1B, 3B, CI, 2B, SS, MI, 5 OF, and one UTIL/DH.  In these two catcher leagues, I perpetually leave games played on the table because no catcher plays 162 games in a season.  But in a league with games played limits, you’re given 324 games to be played by catchers during the season (162 games * 2 catchers).

ThreeCatchers2
2012 Catcher leaders in games played courtesy of Fangraphs. Click the image to view this information at Fangraphs.com.

If  you only carry two catchers all year, by the time you reach the end of the season you could easily be looking at coming up 60+ games short of the allotted 324.  To illustrate, look at the catcher leaders in games played for 2012 (Note:  these are not necessarily the top 24 fantasy catchers, just MLB games played leaders).

Some of the top fantasy options like Buster Posey and Joe Mauer play a lot of games (approaching 150).  But when you start to account for the fact that 24 catchers must be started in a 12-team two-catcher league, you can see how many games will be left on the table (many don’t even get to 120 games).  And each one of those games is a missed opportunity for counting stats like runs, home runs, and RBI.

I hate the idea of using a coveted bench spot to hold the 25th best catcher.  What kind of stat line does such a player have?  But missing out on 60-80 games played seems like a huge missed opportunity.  So let’s get to the bottom of this. Continue reading “Does It Make Sense To Carry Three Catchers?”

Max Scherzer Anecdotes and Analysis

A couple weeks back the Detroit Tigers and the Texas Rangers squared off in ESPN’s Sunday Night Baseball .  You might recall this game because Miguel Cabrera went 4-4 with three home runs and five RBI, the first of four straight games with a HR.

During his time with the Tigers, Buster Olney sat down with Max Scherzer for an in-depth conversation.  Much of the discussion was included in the May 20th edition of the ESPN Baseball Tonight podcast that Olney produces each week day.

Link to ESPN: Baseball Tonight with Buster Olney podcastUS iTunes, App Store, iBookstore, and Mac App Store

In the conversation Olney asked Scherzer about his curveball and here’s what Max had to say:

I’ve been tinkering with the curveball since last year, the second half.  I’ve been trying to find a pitch that slows down everybody.  It’s 15 mph off my fastball.  I feel like everything else is kind of hard and it doesn’t change the hitters timing.  I was able to throw it but the consistency on it wasn’t quite where it needed to be…  By doing that it allows me to have a fourth pitch and a pitch that really slows down and disrupts the hitters timing.  That pitch by itself can help play up every other pitch that I have.

~ Max Scherzer on 5/20/13 Baseball Tonight Podcast

There are a number of very interesting things buried in the comments.  When hearing about Scherzer’s increased use of the curve ball, his ability to more effectively locate the pitch, and the timing problems it might create for hitters, I realized the opportunity to join these anecdotes with data analysis.  If the data supports these comments, we could be looking at a pitcher with the ability to take a gigantic step forward.

1.  I’ve Been Tinkering With The Curve Ball Since Last Year, The Second Half

This is true. In looking at Scherzer’s PITCH f/x data Continue reading “Max Scherzer Anecdotes and Analysis”

Fantasy Baseball Tool Box – BaseballPress.com’s ‘My Lineup’ – Part II

Welcome to Part II of our look into Baseball Press’ “My Lineup” tool (read Part I here), an easy to use yet powerful tool that gives you batting order and lineup information for your specific fantasy players several hours before each game.  In the steps below we’ll take a look at how easy it is to set up an account and configure your lineup.  You can expect to be registered and have your players identified in less than 15 minutes.

 1.  Create Account

Visit BaseballPress.com and click the “Create Account” link on the top right corner of the page.

MyLineup1
Click “Create Account”

2.  Register

Create an ID / Nickname for your account and enter your e-mail address (you’ll be sent an email to validate the address).  After you’ve filled everything out (including the “prove you’re not a robot visual test”), click the “Create Account” button to proceed.


MyLineup2
Enter an ID and e-mail address.

3.  Activate Your Account

Continue reading “Fantasy Baseball Tool Box – BaseballPress.com’s ‘My Lineup’ – Part II”

Fantasy Baseball Tool Box – BaseballPress.com’s ‘My Lineup’ – Part I

It’s hard to believe that after a 162-game season involving rosters of 25 or more players, that a fantasy baseball championship could be decided by several counting stats (a few stolen bases, runs, etc.), but it’s true.  The final standings of any league can absolutely be affected by a simple strategy like making sure your daily lineup is full of players that are starting that day.

Final League Standings – Tied for First

Look at the “Total GP” column in the final batting statistics shown below.  While they tied for first, one team managed to squeeze out 46 more games played over the course of the season (2,155 – 2,109).  That’s an easy 2% of statistical output left on the table for “The Naturals” (46 / 2,109 = 2.2%).

Final Statistics – Tight Finish in R, HR, RBI, and SB

It’s probably not safe to do a straight extrapolation of the numbers, but a 2% increase in the final stat totals amounts to about 23 more R, 6 more HR, 21 more  RBI, and 3 more SB.  We can’t even see the full standings above, but that’s at least 1.5 more rotisserie points “The Naturals” left on the table.

And All I Had To Do Was Set My Lineup

“The Naturals” was my team.  I mustered a tie on the last day of the season.  But could have earned exclusive bragging rights by simply setting an accurate lineup every day.  I wish I had found BaseballPress.com’s “My Lineup” tool sooner.

What Is the “My Lineup” Tool?

The guys at Baseball Press have created a free utility through which you can easily enter the players on your fantasy teams, save that list of players, and then check the “My Lineup” site to see which of your players is in/out of the lineup that day (look at the warnings for Norichika Aoki and Billy Butler bel0w).

MyLineupIntro3

I’m Not Impressed Yet.  What Else Does It Do?

In addition to acting as a central location where you can view the status of all your teams’ players, you’re also provided with where each player will hit in the batting order (the “LP” column), the opposing pitcher (and if they’re a RHP or LHP), and weather information.

As we have looked into before, where a player hits in the batting order is a significant component in a player’s level of production, so it’s great to see this information prominently displayed on the page (you don’t have to dig through 10 box scores to monitor where your players are hitting).

Weather information can help you avoid potential rain outs (see Allen Craig and Matt Carpenter facing a 98% chance of rain).  Great information in weekly H2H leagues or daily draft formats.

I’m Busy, I Don’t Have Time For Another Site To Visit

To be honest, that was my initial fear.  But Baseball Press prides themselves at being the first to publish accurate starting lineups.  I had no idea, but most times lineups are available several hours before the game.  I envisioned that I would have to diligently check “My Lineup” every night at 6:30PM to find it useful, but that’s just not that case.  It seems like lineups are often available up to four hours before game time and already entered in at BaseballPress.com.

The site is also easily accessible from any mobile device (the screenshot above is from my iPhone).  The facts that lineups are available hours before game time and available on my phone make it very easy to use.

How Much Is This Going To Set Me Back?

It’s free.  All you have to do is to create an account at Baseballpress.com and then add the players you want to monitor.

Is It Difficult To Set Up?

I found it very easy to create my account and add players.  I registered and had the players from four fantasy team rosters entered in about 10 minutes.

Up Next

In Part II of this look at BaseballPress.com’s “My Lineup” tool, we’ll go through step-by-step instructions to create your account and add players to your lineup, as well as a few tips on how to make the most of the site.

Special Thanks

Thanks to Reggie (follow Reggie on Twitter) and Nate (follow Nate on Twitter) of BaseballPress.com (follow the website’s own Twitter account), who have built this tool and agreed to let me spotlight it here.

Be smart.