Welcome to the sixth and final part of the “Create Your Own Fantasy Baseball Rankings” series. If you missed an earlier part, you can find it here. You can start at the beginning of the series or if you want to start here at Part 6, you can download the Excel file created during part 5 here.
Please note that this six part series has been adapted into a 10 part book that also shows you how to convert standings gain points into dollar values and how to calculate in-draft inflation.
A few notes about the series:
- It was originally written before the 2013 MLB season. The screenshots and player references you see might refer to things from that time frame, but the same approach will work today.
- If you register as SFBB Insider, you can receive all six parts in a free, tidy, and easy-to-use e-book
- Familiarity with Excel is recommended, but I do my best to explain all formulas and functions used
- Some of the formulas used in the series do not work in Excel for Mac computers. I apologize for this. I don’t understand why Excel isn’t built to operate the same on that platform.
In this sixth part of the series we will discuss the concept of replacement level players and calculating for position scarcity.
Replacement Level Players
Mike Trout is projected for 114 R, 26 HR, and 83 RBI. Those numbers are gaudy. But should he get “credit” for all those statistics if I can go out the day after the draft and pickup a player on the free agent list that is projected for 50 R, 15 HR, and 55 RBI?
This is the concept of replacement level. If player X is projected for 26 HR and there are several free agents that will hit 15 HR, the true value of player X is in his 11 additional HR (26 – 15).
So when calculating a player’s SGP, you should not perform the calculation on the “gross” or total number of HRs. Rather, you should calculate SGP with the amount of HR over a replacement level player (a free agent).
Determining Replacement Level
Assuming a 12-team league with 14 hitters (two C, 1B, 2B, SS, MI, 3B, CI, five OF, DH), 168 offensive players will be drafted (you can add more to adjust for bench players). So the 169th player is “replacement level”, right?
Arguably this is true. But let’s fine tune this a little more. In a 12-team league where each team must start two catchers, the 25th best catcher is the “replacement level catcher”.
If the league request one 2B, one SS, and one Middle Infielder, then 36 combined 2B and SS will be drafted. We can assume this will be comprised of 18 2B and 18 SS, and the 19th best of each position will be the “replacement level”.
Likewise, you might expect 18 1B, 18 3B, and 60 OFs to be drafted. But given that these positions typically produce better offensive statistics than 2B and SS, 1B and OF tend to be slotted into the UTIL/DH spots. This can push the 1B up to 24 selected players and the OF up to 66 selected players (with the 25th 1B being “replacement level” and the 67th OF being “replacement level”.
Let’s look at some projected statistics for Jason Heyward and Robinson Cano (please note the tables below don’t foot due to rounding) :
| Category | Heyward | Cano |
|---|---|---|
| R SGP | 3.82 | 3.58 |
| HR SGP | 2.60 | 2.40 |
| RBI SGP | 3.62 | 3.98 |
| SB SGP | 1.38 | 0.32 |
| AVG SGP | 0.12 | 0.96 |
| TTL SGP | 11.54 | 11.25 |
On the surface, the two are near equals, with Heyward holding a slight overall edge in SGP. But let’s now compare each to a replacement level player at their position. In my rankings spreadsheet, the 61st ranked OF is Ryan Ludwick.
| Category | Heyward | Ludwick | Heyward over Ludwick |
|---|---|---|---|
| R SGP | 3.82 | 2.32 | 1.50 |
| HR SGP | 2.60 | 1.92 | 0.68 |
| RBI SGP | 3.62 | 2.72 | 0.90 |
| SB SGP | 1.38 | 0.11 | 1.27 |
| AVG SGP | 0.12 | -0.14 | 0.26 |
| TTL SGP | 11.54 | 6.93 | 4.61 |
In my rankings spreadsheet, the 19th best 2B is Gordon Beckham.
| Category | Cano | Beckham | Cano over Beckham |
|---|---|---|---|
| R SGP | 3.58 | 2.20 | 1.38 |
| HR SGP | 2.40 | 1.25 | 1.15 |
| RBI SGP | 3.98 | 2.07 | 1.91 |
| SB SGP | 0.32 | 0.53 | -0.21 |
| AVG SGP | 0.96 | -0.35 | 1.31 |
| TTL SGP | 11.25 | 5.67 | 5.54 |
So despite a higher gross SGP (11.54 vs. 11.25), Heyward comes out as less valuable when we adjust for replacement level players. In fact, Cano moves to nearly one whole SGP of an advantage over Heyward (5.54 vs. 4.61).
As you can see in this example, ADJUSTING GROSS SGP FOR A PLAYER BY BACKING OUT THE VALUE OF A REPLACEMENT LEVEL PLAYER AT THE SAME POSITION ADJUSTS THE RANKINGS FOR POSITION SCARCITY.
Step-By-Step Instructions
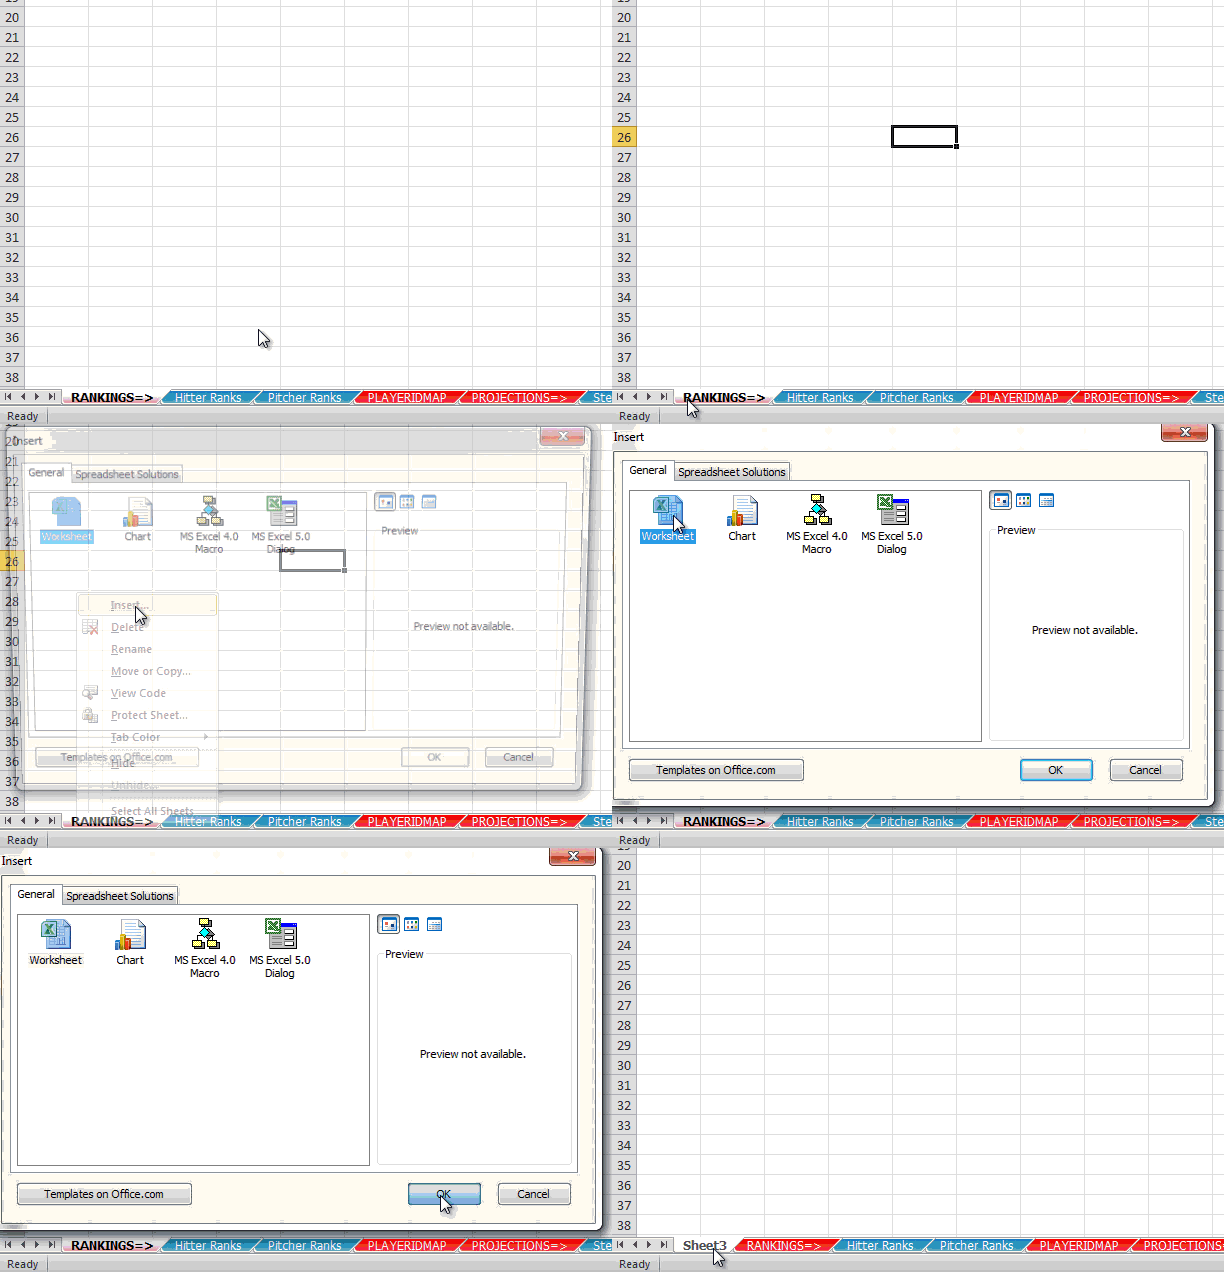
- We first need to add a new tab to our spreadsheet. Right-click on the “RANKINGS=>” tab and choose the option to “Insert…”. Then choose to add a new worksheet (Or a faster way to do this is to click once on the “RANKINGS=>” tab. Press and hold the SHIFT key. Then push and release your F11 key.).
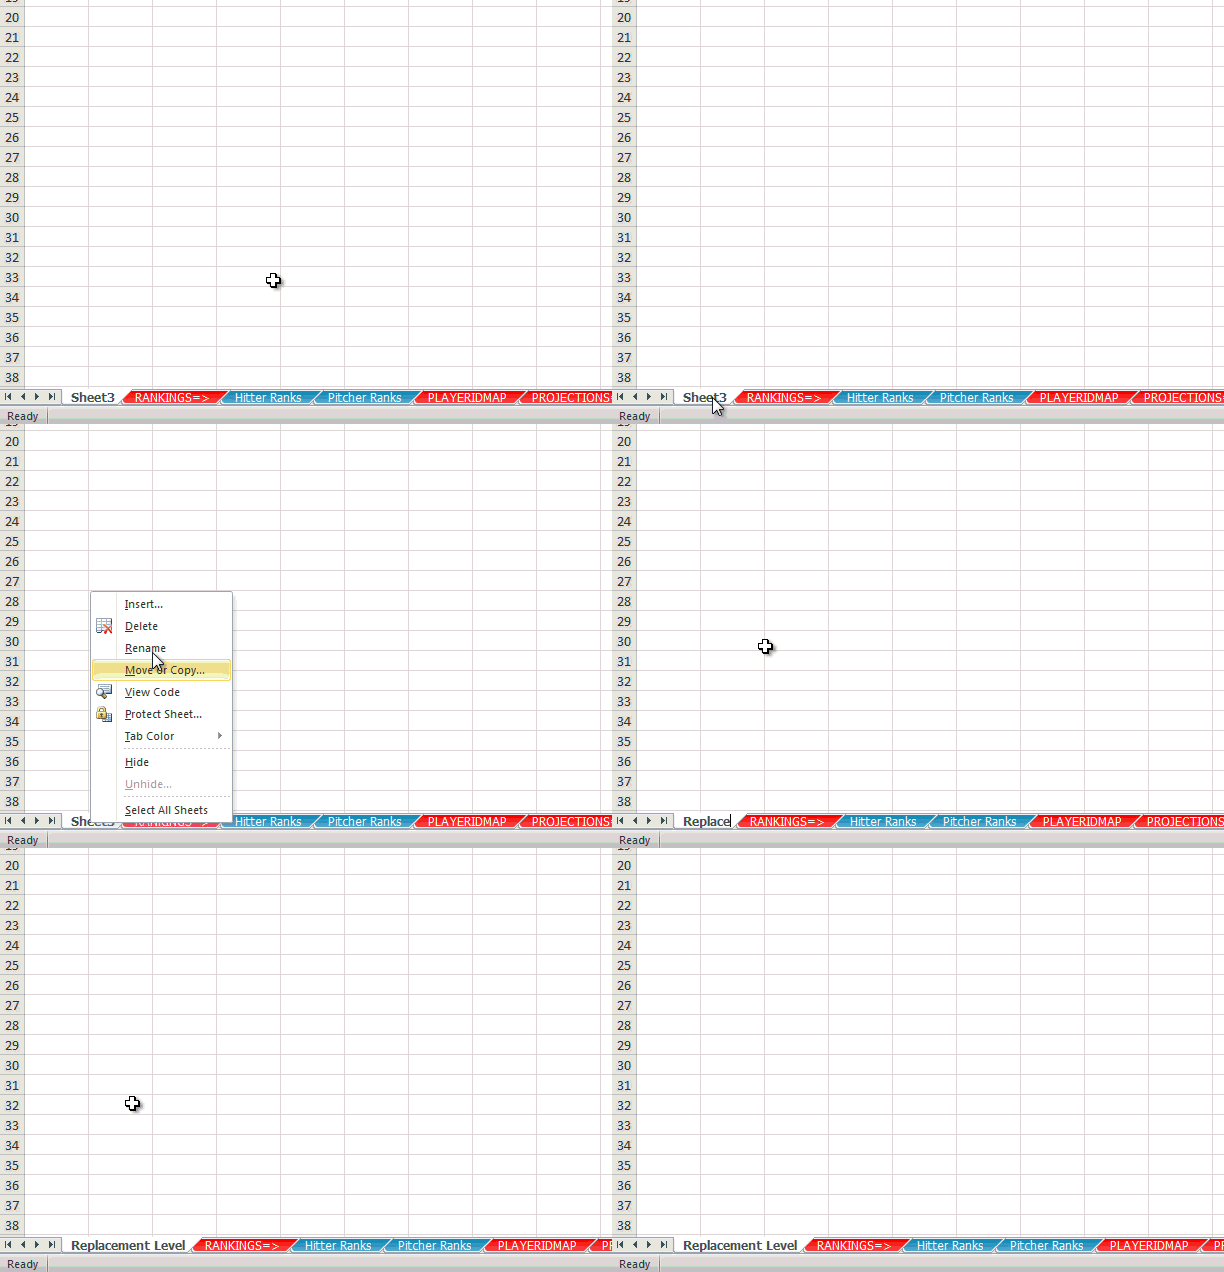
- Right-click on the new sheet and select “Rename”. Name the sheet “Replacement Level”.
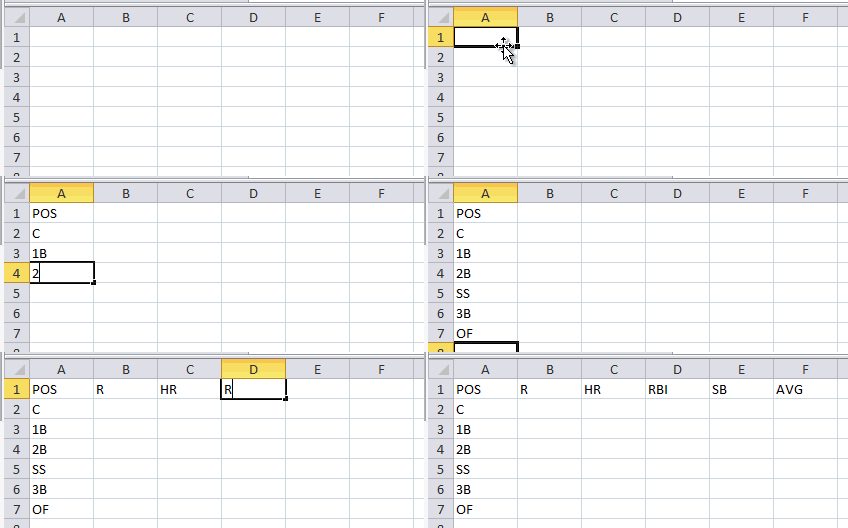
- Begin to fill out the framework of a table by keying in the following:
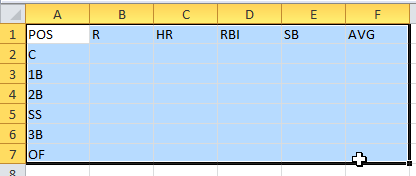
- Click and drag with your mouse to select the area of the table you have started:
- On the “Home” tab, select the option to “Format as Table” and choose your desired color scheme. Specify that your table has headers when prompted.

- Click on the “Formulas” tab and select “Name Manager”.
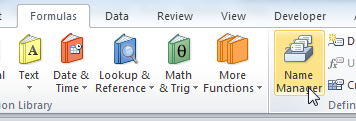
- In the ensuing menu, select the unnamed table (which should relate to the Replacement Level tab we just created). Chose the “Edit…” option and provide a new name for the table.
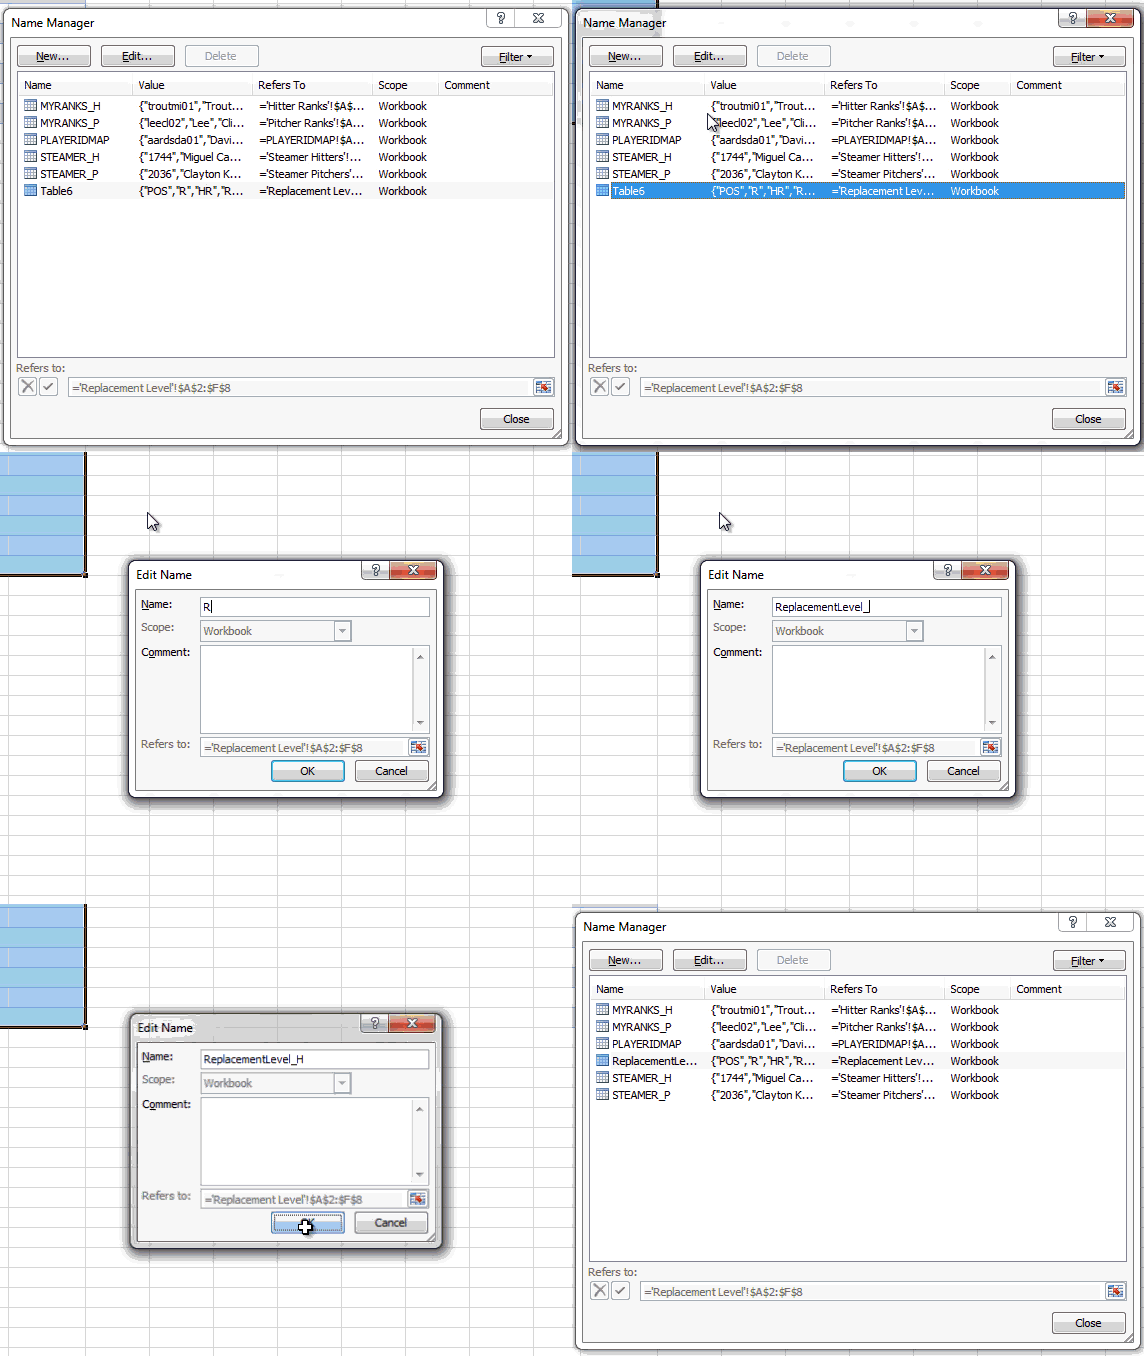
- Give the table a name (e.g. “ReplacementLevel_H”). Hit OK to accept the changes.
- Return to the “Hitter Ranks” tab. Use the drop down arrow on the “TTLSGP” column to ensure it is sorted in descending order (players with most SGP at the top).
- Click on the downward pointing arrow on the “POS” column. Clear all the position check boxes and select only “C”. Click “OK” to accept this filter.
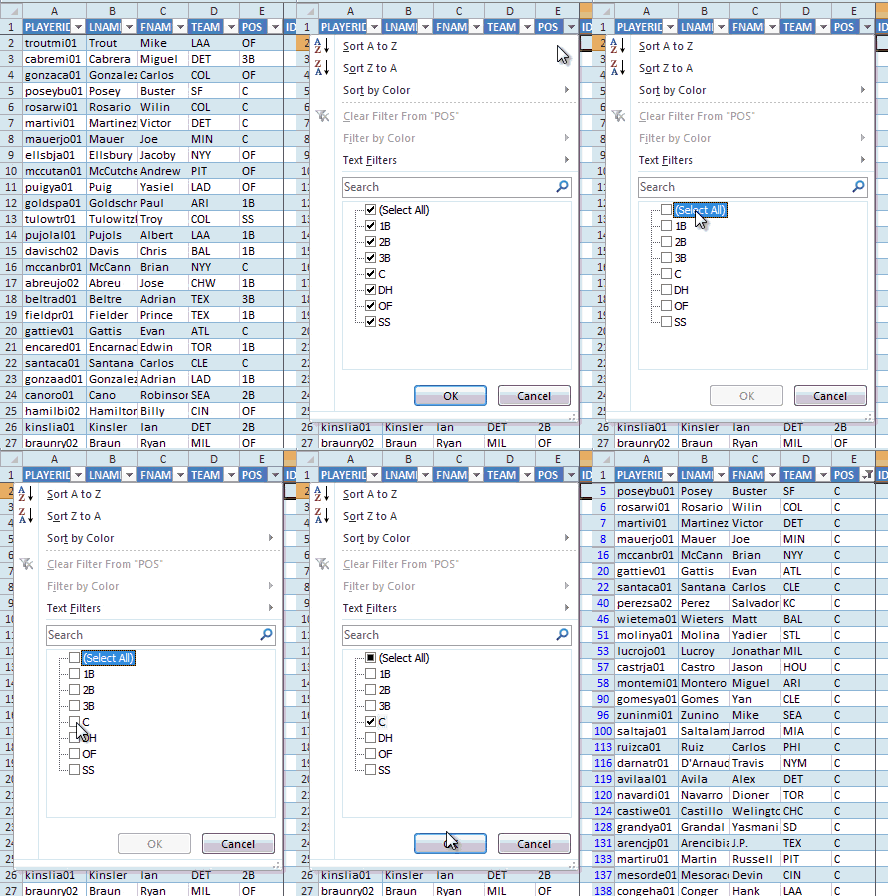
-
 Use your league settings to develop an approximation of how many catchers will likely be drafted. For example, in a 12-team league in which each team starts two catchers, there likely won’t be any catchers starting at the DH/UTIL spot. This means that 24 catchers will be drafted and the 25th catcher represents replacement level.
I believe that identifying one specific player as “replacement level” can be misleading and that it is best to develop a “composite” of the replacement level player. For example, what if the 25th catcher happens to steal a lot of bases and all his value comes from this stat. It would be misleading to compare all the other catchers to this player.
To calculate this approximate replacement player I suggest creating an average of five players. The average will be of the last draftable player and the two players above him and the two players below him. Sticking with our example that 24 catchers will be drafted, I will use catchers #22, #23, #24, #25, and #26.
Any easy way to figure out who these catchers are is to choose a specific column, click on the value for the first player in the column, and then click and drag to select more players (you can see an image of this to the right, make sure you are highlighting only one column).
As you continue to select more players, watch the “Count:” field on the Excel status bar.

-
In looking at the 22nd – 26th best catchers, I see a rough average of 1.39 SGPs in R, 0.87 in HR, 1.41 in RBI, 0.13 in SB, and -0.35 in AVG.
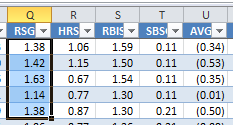
Note that if you select the RSGP information for catchers #22-#26 as shown above, Excel will display the average on the status bar in the lower right hand corner of the program.
- Enter these averages into the Catcher row on the “Replacement Level” tab.
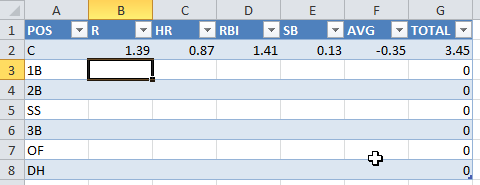
-
Repeat steps 10 – 13 for each position.
If your league starts Corner Infielders and Middle Infielders, you can likely assume that will break down into an even split between 1B & 3B and 2B & SS. For example, in a 12-team league with a CI position, a total of 36 1B or 3B will be drafted (12 1B, 12 3B, and 12 CI). I usually assume this will break down to18 1B and 18 3B. This won’t be exact, but splitting hairs about this will not result in much of a benefit to your rankings.
You must perform a similar adjustment for the DH/UTIL spot in your league. Again, assuming a 12-team league, we must now adjust replacement level by 12 more players. I generally assume this will result in 6 more OF being drafted and 6 more 1B, because 1B and OF are generally the most productive positions. This means that I assume 24 1B will be drafted (12 to play 1B, 6 to play CI, and 6 to play DH/UTIL) and 66 OF (60 to play OF (5 * 12-teams), 6 to play DH/UTIL).
It is important to keep in mind that these numbers are highly dependent upon two things that will cause the numbers I present below to differ from what you will see as you work with your own spreadsheet:
- The underlying projections used
- Your league settings
The projections you use will surely be different from those I used to create this guide. For one, I created this guide using the 2013 Steamer projections. You will be using some projection set you obtained after 2013. The projections you use determine the statistics of the replacement level player. So your replacement level player will not be the same as mine.
Further, your league settings may be different. I am assuming a 12-team league starting 2 catchers. If you have a 10-team league or if your league starts only one catcher, your definition of who the replacement level player is will be different.
With those caveats in mind, here are the approximations I calculated using the 2013 Steamer projections for replacement level players assuming a 12-team league starting 14 hitters, 9 pitchers, and no bench spots:
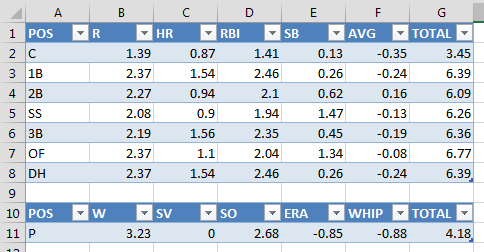
Note, the player pool for “DH” only hitters, like David Ortiz, is very small. Too small to get a meaningful determination about replacement level. I make the assumption that 1B is the best approximation of replacement level for players only eligible at DH .
- Now that we’ve determined what “replacement level” is, we need to adjust our SGP calculations to back out the statistics of a replacement level player. The trick here is that the Hitter Ranks sheet has players of all positions and the Replacement Level sheet has a table containing the corresponding replacement level statistics for each position. To subtract out the replacement level statistics for each position, we need to adjust this formula to go into the “Replacement Level” tab, find the player’s position, then retrieve the amount to subtract. Recall the VLOOKUP formula can be used to search in another table for a specific value (look in the replacement level information and find a specific position).You’ll remember the original formula for RSGP was =[@R]/24.6
 Subtracting replacement level data from this using VLOOKUP yields this formula:
=[@R]/24.6-VLOOKUP([@POS],ReplacementLevel_H, COLUMN(ReplacementLevel_H[R]),FALSE)
If you’d like clarification on using the VLOOKUP formula, be sure to check out Part 3 of this series.
- Add VLOOKUP formulas for the remaining hitting categories
CATEGORY FORMULA R =[@R]/24.6-VLOOKUP([@POS], ReplacementLevel_H, COLUMN(ReplacementLevel_H[R]), FALSE) HR =[@HR]/10.4-VLOOKUP([@POS], ReplacementLevel_H, COLUMN(ReplacementLevel_H[HR]), FALSE) RBI =[@RBI]/24.6-VLOOKUP([@POS], ReplacementLevel_H, COLUMN(ReplacementLevel_H[RBI]), FALSE) SB =[@SB]/9.4-VLOOKUP([@POS], ReplacementLevel_H, COLUMN(ReplacementLevel_H[SB]), FALSE) AVG =(([@H]+1768)/([@AB]+6617)-0.267)/0.0024 – VLOOKUP([@POS], ReplacementLevel_H, COLUMN(ReplacementLevel_H[AVG]), FALSE) - Perform steps 3-8 in order to create a pitchers replacement level table on the Replacement Level tab. This will be a much simpler exercise as there is only one position for pitchers. Name the table ReplacementLevel_P.
- Perform the equivalent of step 11-13 for pitchers. In a 12-team league that rosters 9 pitchers, 108 starting pitchers will be drafted, leaving the 108th best pitcher as “replacement level”. Looking at pitchers 106 – 110, here are the replacement level average SGPs I come up with for pitchers:
POS W SV SO ERA WHIP TTL P 3.23 0 2.68 -0.85 -0.88 4.18 - Enter the averages into your newly created ReplacementLevel_P table.

- To subtract out the replacement level statistics for pitchers, we need to adjust the formulas to go into the “Replacement Level” tab, find the pitcher replacement level statistics, then retrieve the amount to subtract. Recall the VLOOKUP formula can be used to search in another table for a specific value (look in the replacement level information and find a specific position. You’ll remember the original formula for WSGP was =[@W]/3.03.
 Subtracting replacement level data from this using VLOOKUP yields this formula:
=[@W]/3.03-VLOOKUP([@POS],ReplacementLevel_P, COLUMN(ReplacementLevel_P[W]), FALSE)
- Add VLOOKUP formulas for the remaining pitching categories. Note, I assume all starting closers are taken in 12-team leagues; therefore, there is no reason to make a replacement level adjustment.
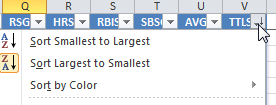
CATEGORY FORMULA W =[@W]/3.03-VLOOKUP([@POS], ReplacementLevel_P, COLUMN(ReplacementLevel_P[W]), FALSE) SV =[@SV]/9.95 SO =[@SO]/39.3-VLOOKUP([@POS], ReplacementLevel_P, COLUMN(ReplacementLevel_P[SO]), FALSE) ERA =((475+[@ER])*9/(1192+[@IP])-3.59)/-0.076-VLOOKUP([@POS], ReplacementLevel_P, COLUMN(ReplacementLevel_P[ERA]), FALSE) WHIP =((1466+[@BB]+[@H])/(1192+[@IP])-1.23)/-0.015-VLOOKUP([@POS], ReplacementLevel_P, COLUMN(ReplacementLevel_P[WHIP]), FALSE) - It’s possible that some players would rise or fall in the total SGP ranking after these changes. Sort the hitter and pitcher ranks from highest value to lowest value again using the drop down arrow over the “TTLSGP” column.
-
It is extremely important to perform a reasonableness check when you’re done with this exercise. If you have done everything correctly, when you’re done, you should see that the number of players with positive SGPs should be approximately equal to the number of players your league will draft.
For example, I have been assuming a 12-team league where each team drafts 14 hitters. This means 168 hitters will be drafted. If I look in my “Hitter Ranks” tab, I should see that the players right around the #168 mark will have very close to 0.00 for TTLSGP.
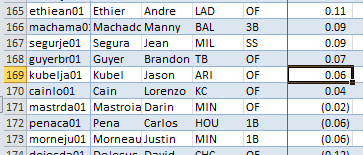
Row #169 represents the 168th player (accounting for the header row in the sheet). And you can see everyone here is about at 0.00 SGP
If you find that you have too many players above 0.00 TTLSGP, you must raise your replacement level calculations. If the replacement level averages are higher, fewer players will come out above 0.00. If you have too few players above 0.00 TTLSGP, you must lower your replacement level calculations. If replacement levels are lower, more players will come out above 0.00.
- You did it! You now have completed hitter and pitcher rankings based upon reliable projection data that also takes into account and adjusts for position scarcity.
WRAP UP
You have just created a very powerful and flexible tool. You can easily adjust the projection data and have your changes instantly flow through the calculations and update the rankings accordingly.
LINK TO DOWNLOAD FILE: SFBB Rankings – Part 6.XLSX
IF YOU’VE MADE IT THIS FAR…
You might be interested to know that I’ve recently completed parts 7 through 10 of the “Create Your Own Rankings” series. These additional segments include the calculation of dollar values and incorporate calculations for keeper and in-draft inflation. All ten parts of the book are now available in Kindle format at Amazon. Please click here to read about these additions to the guide and how you can purchase all 10 parts. My hope is that this series is the best step-by-step guide to calculating SGP-based dollar values and inflation is available anywhere.



Please post your questions or suggestions to improve the rankings system in the comments here.
This series was brilliant! I found a great way to spend those cold january nights while waiting for the new season, thanks!
Thanks, Fabio. I’m glad you like it. I’m working on accumulating all the posts in the series and converting them into an e-book, so you can have them all in one more convenient location. Download it. Refer to it in the future. Whatever. Please continue to check back with the site. I hope to have it ready soon.
I found these posts very informative. I have since taken your ideas and modified the excel file so that instead of copying and pasting 3 years for each player, I paste each season in it’s own tab and then vlook up the results. Doing this allowed me to project 587 hitters in just 4 hours. Once I moved over to pitchers I noticed you don’t have an regression analysis for them? I dug through the ebook and there was no mention of it in there either. Can you assist? I’d be happy to send you what I’ve done so far. In addition you should do a post on building a trade analyzer in excel since you already did a post on it. But to include that into our excel files will really give us an edge on how pickups and trades would affect our teams. Great info so far… I’ve read almost you’re entire site.
Thanks, Jason. The process you describe certainly is one way to do projections. It’s a very fact-based, history-based, quantitative approach that certainly has its merits. I really like the approach Mike Podhorzer uses in Projecting X because I found it very helpful to see the full stat line of a player come together, and it’s also very fun to play with the inputs of the projection to see how they affect the end result. You lose that touch with a purely regression-based model. But in the end, the regression-based model is more scientific and less prone to bias and error that I am entering into the equation.
I had never tried my hand at my own valuations because I’m hopelessly innumerate and don’t know the first thing about Excel. This series was fantastic!
But after my first attempt for my 14-team, mixed, 5×5 league, I’ve found two things that indicate I may have done something wrong:
I don’t even have 14 catchers that have positive value.
Some values for my stars are outrageously high (Miggy came up at $71). Those prices are occasionally paid for the top 5 in my league, but I assumed that was auction behavior, not true value.
I forgot to mention that I got the values by plugging in the SGP denominators I determined via SFBB’s guidance.
Mikeup, thanks for the kind words. I do hope to get some instructions on converting all of this into dollar values up on the site soon. But I’m finding it difficult to squeeze in the time. You can see a high level discussion in the comments on Part 5 of this series here: https://www.smartfantasybaseball.com/2013/03/create-your-own-fantasy-baseball-rankings-part-5-understanding-standings-gain-points/
The fact that you don’t have enough catchers with positive value does indicate a problem. At the auction those players have to go for at least $1. So if you were to somehow correct the issue and those players do come to positive value, that would suck dollars away from Cabrera and other high priced stars and move the money to these catchers.
I must be really excited about this season, because I keep making incomplete posts. What I meant to say was that I plugged in the SFBB denominators in Rotolab, which also lets me adjust for position scarcity, hitting/pitching budget split, and league auction behavior (Stars’n’Scrubs vs Spread The Risk). Rotolab and SFBB are turning out to be a great, complementary combo.
Thanks for the response and for this great tool! I’ll have to figure out how I can adjust those catcher values. After I reviewed more carefully my best guess at my league’s potential keepers, I realized that there are actually several catchers being kept. So I may only need to adjust one or two guys to bring them up to positive value.
3B is actually the position that concerns me most this year, but that’s another conversation.
How do you treat guys with multiple position eligibility when determining your replacement level player? For example, do you leave Buster Posey in your list of first basemen, even though he obviously has more value as a C?
Seems to me you can only use a guy once, otherwise you will end up with less than the requisite # of players in your final pool.
I assign multi-position eligible players to the weakest position they qualify for. For example, Posey is treated as a Catcher because of the weakness at that position in comparison to 1B. This gives Posey the most value and is very likely what he will be drafted for.
Also, why do you assign replacement level stats for each category? Why not calculate a raw total SGP for everyone than pick the 13th catcher’s raw SGP (in a 1 catcher league) as the replacement level?
You could just make one replacement level adjustment to each player’s total SGP instead of determining it at each category. I could envision a scenario where having the “above replacement level SGP” for an individual category being helpful. Perhaps you’re in the middle rounds of the draft, and you know you need to improve your HR total and you care less about SB at this point, having drafted a couple of speedsters already. In this scenario, having each player’s “above replacement level HR” could help you make a better decision. Whereas, if you only adjust “Total SGP”, you can’t really see that.
It’s not going to make a big difference. But it’s not much more difficult to do and I can see the information coming in handy.
Great series. What’s the best method to update the projection tables (steamer, zips, etc.) for updated projections? Simply copying and pasting the data to the previously set up tables does not seem to work. Thanks.
Thanks, Ryguy. I hope to eventually get up a post about this. But I’ll try to briefly summarize here.
If you stay away from the header rows, you can paste in the updated information. If you try to paste into cell A1, you’ll have issues.
Hey Tanner, I was trying to update the ranking following your instructions and I couldn’t get figure it out. So my question is, when you release the new article/post is the sheet that is available for download up to date with the fangraph rankings?
Let me know where I went wrong:
With the formula for WSGP adjusted with replacement value for a pitcher, you are dividing the Wins by a negative fraction (3.03 – 3.3= -.027) resulting in a very large negative number. All the other formulas work fine, so I’m wondering if I just made a mistake on this one. To verify, I even bypassed the vlookup function and linked directly to the relevant cell in the ReplacementLevel_P table. Either way you slice it, 15 wins divided by -0.27 equals -55.556. Am I misunderstanding something here?
Thanks! I love the tool, and just wish I could get this one to work.
I think you just have an order of operations issue. You should divide the Wins by 3.03 first to get your raw calculation of SGP for the player. For example, a pitcher with 15 W would earn 4.95 SGP (15 / 3.03). Then this is subtracted from the SGP the replacement level pitcher has for Wins. If the replacement level pitcher has 10 W, then he would be given 3.30 SGP for W. So the 15 W pitcher would come out at 1.65 SGP after adjusting for replacement level (4.95 – 3.30 = 1.65). Hope that helps!
Are these rankings designed to compare batters to pitchers or should they be kept as separate and distinct categories? Starting pitchers are flooding my top ranks.
Your league’s settings and roster sizes can have a big effect on how pitchers are valued compared to hitters. As silly as it might sound, even if you don’t play in an auction league, I would convert hitters and pitchers into dollar values. This allows you to apply the 65-35 or 70-30 hitter-pitcher split. It forces the value of all pitchers to be 30% of all players (or 35%), and hitters to be 65-70%.
After you do that, you can then compare a pitcher to a hitter more safely.
Wow, what a superb series. Thankyou for taking the time to post it. I look forward to getting my own rankings sorted out according to these instructions – need to think about my two catcher league in which I’ve seen your other article about Posey’s hidden value as well.
Nevermind, this is all set up for 2 catchers. Good to go!
Thanks, Dave. Glad you enjoy it. Yep, already configured for two catcher leagues. Standard roto lineups are the way to go!
Tanner, working on my replacement level formulas for the hitters. They are working except when I get to average. When using the suggested formula =(([@H]+1768)/([@AB]+6617)-0.267)/0.0024 – VLOOKUP([@POS], ReplacementLevel_H, COLUMN(ReplacementLevel_H[AVG]), FALSE) I am getting an error message. Excel highlights this part of the formula, “0.0024–” to show me where the error is, but being a neophyte on Excel, I don’t know what to do. Do you?
Thanks
Matt
Try deleting that minus sign after 0.0024 and retyping it yourself. If there are any extra spaces surrounding that minus sign, remove those as well.
Perfect, Tanner. Thanks, it worked like a charm.
In part 6 on Replacement Players, step #8, p. 59, you suggested the following name for the replacement level hitters table: “Replacement Level_H”. I suggest eliminating the space between Replacement and Level. I can’t remember exactly what happened last night when I was doing this, but it seemed that whatever was supposed to get pulled from those tables did not get pulled without making the change.
Thanks.
Thanks, Matt. You’re 100% correct. It should be “ReplacementLevel_H” with now space. I have fixed the error in the post above.
Tanner – awesome stuff! I am new to this, but trying to figure out whether any of your examples combine or average multiple projections? I see in the example spreadsheets you download, ZIPS, Oliver, Steamer, etc, but are you then only using one of these as a start for your projections or do you combine them to get an average projection for each player? Thanks.
Hi Mark. The original intent when I started writing the series was to average those multiple projections. I soon realized that is a topic that could produce its own 50 pages of material, so I had to change plans. I averaged projections for the first time this year (did it last weekend). I hope to write about how to do it. Maybe I’ll have something ready by next year. In the meantime, FantasyPros.com has a neat tool that allows you to choose from several sources and get a downloadable file with averages. They have some nice systems available to choose from too.
Tanner, Great Stuff! but i`m gonna play in 14 team mixed auction with no history at all…do you know where i can get SGP`s for a league like this?
Michael
Hi Michael, unfortunately I don’t have data like this available. I do think you can just use the SGP formulas I outline for a 12-team league. While a 14-team league will change things somewhat, using the 12-team factors will probably be more accurate than formulas being used by the rest of your league. So you should still have an advantage.
How would I adjust for a league with bench spots? I’m guessing the process of selecting which players to use for the replacement level values would change, but I can’t figure out how. Thanks!
Hey Mike. Let’s use a simple example of a 12-team league that starts 2 C, 1B, 2B, 3B, SS, MI, CI, 5 OF, UTIL and has 3 bench spots. Your league tendencies may vary, but let’s say that most teams end up using two of the spots on extra hitters and one spot on an extra pitcher.
That gives us 14 starting hitters and 2 bench hitters for each team. That’s 16 hitters total. So that’s 192 hitters (12 * 16). We know we need at least 24 C, 36 1B/3B, 36 SS/2B, and 60 OF. That’s 146 hitters. That leaves 46 more to select (192 – 146 = 46). Those remaining 46 are just the best players at any position.
I do include bench players in my calculation of dollar values, because they are important, you do have to pay money for them at an auction, and they provide value. Most bench players end up coming out at less then a few dollars, so they’re not taking too much value away from the others.
Just now coming across these articles, so first off Tanner I want to say I appreciate the level of thought and detail you’ve put into everything, particularly in your responses. I just started creating my own rankings and have been leveraging work from different sources, in particular Chad Young and Zach Sanders, so right now I’m working on replacement level calculations. I’m in a couple of 5×5 Ottoneu leagues and a 6×6 NL Only Keeper league and because of that I went the z-score route as it seemed more likely to produce consistent results across the different formats.
You mention you include players with multi-positional eligibility at their weaker position. That said, it would seem like it would make sense to include them at both positions, if only to be included in replacement level determination. Maybe this makes more sense in utilizing z-score rankings, but I’m interested to hear your thoughts.
Thanks again for all this information.
Hi Jason. Thanks for giving the site a chance!
I completely agree that there would be a benefit to seeing a player listed at all positions, but I’ve just never been able to find an effective way to pull it off. In the end, I’ve concluded that the benefit that would provide is not worth the cost of implementing it.
Here are some of the problems you’ll face by listing guys multiple times:
1. I also use my valuation spreadsheet as a way to track things during the draft. It becomes very messy to have to remember that you need to be looking for guys multiple times to mark them off as drafted.
2. A player can really only be slotted at one position. For example, if you draft Chris Davis next year and put him as your 3B, then he really shouldn’t be included in the replacement level determination for 1B too. He can’t play both at the same time.
3. When you go to take the next step from calculating SGP or z-scores and translate those into dollar value calculations, you can’t have players included more than once. Just for example, say Chris Davis provides 3 z-scores over replacement level at 3B or 2.5 z-scores over replacement level at 1B. You don’t want his 5.5 z-scores going into the calculation of dollar value of one z-score.
Apologies if my z-score terminology is a bit off. I am familiar with the approach but don’t use it very often.
With all of this said, I have written a few posts about how I can still get the information about a player’s other positions without needing to include them more than once in the spreadsheet.
https://www.smartfantasybaseball.com/2014/09/an-even-better-positional-ranking-formula/
https://www.smartfantasybaseball.com/2014/09/how-do-you-account-for-and-value-players-with-multiple-position-eligibility/
Hope that helps. Let me know if I’m not accounting for something in the z-score approach.
Thanks Tanner. Definitely agree from both the perspective of calculating salaries and using the sheet during the draft, and overall the more I think about your response I think it makes sense.
My thought was, and lets use Buster Posey as an example, that if I determine the replacement level at Catcher to be the 30th ranked player, and at 1B to be the 27th ranked player, Posey is in both of those categories. If I’m removing him from the pool of 1B, because he can technically be played there, my replacement level then becomes the de facto 28th player, which would “inflate” the Value Over Replacement calculation.
Maybe I’m over thinking it, because a player can only be used at one position, but before a draft you do have the opportunity to use them at different positions.
Try thinking of it this way… Assume a 12-team league where 14 hitters are drafted. So 168 hitters are taken. And now let’s use your example and let’s say the 27th ranked 1B happens to be replacement level and is the 169th best hitter.
Buster Posey can still only appear once in that top 168. It would distort your calculations if you include him twice. You wouldn’t want to have only 167 players in your top 168. Exactly 168 hitters have to be drafted.
I don’t think counting a player like Posey only once (at C) distorts or inflates values. But I do think counting him twice (at 1B and C) would.
Is it necessary to have two different replacement level values for 2B and SS or could they just share one MI replacement value? Same for 1B/3B and CI.
It seems to me that rather than taking the 18th best 2B and the 18th best SS you could just use the 36th best MI and use the same values for 2B and SS. This would be easier to calculate and I would think slightly more accurate to account for draft years where more or less of each are used in the MI spot. We already know who the top 36 MI are as long as there are at least 12 of each and I would think that is usually the case.
Hi Thomas, I’ve since refined the way I determine who the replacement level players are. You can see a better approach here. https://www.smartfantasybaseball.com/2014/11/how-to-use-excel-to-determine-replacement-level/
This approach doesn’t assume an even 18/18 breakdown between 2B and SS. It will help you find the best 36, so it might be the top 20 SS and top 16 2B. And you’ll clearly be able to see who was in the top 36 and who wasn’t. I’ve always had difficulty making sense of things when I come back weeks later after a couple guys have been injured and need to figure out how to adjust replacement level, so this colorful/visual approach should help with that.
You could just use the same values for 2B and SS, but I think you get a small incremental benefit from using separate values. In my mind, if a 2B on your team gets hurt, there’s a chance you actually need to replace him with a 2B and a SS won’t do. So having that true measure is slightly more indicative of the value. But it’s not going to make a big difference either way.
Hey Tanner,
Terrific series. I’ve gone through all of the steps, and just bought the e-book as well. When doing my “sanity” check on the values, I noticed that there are a lot of players with negative values.
I’m in a 13 team league that starts 14 hitters. 182 drafted hitters (with hitters in bench slots as well). The hitter values get to be negative at around hitter ranked 142. How would you adjust?
Hi Jonathan,
Thanks for supporting the site! The sanity check is a very important thing. I’m glad you did it. If you’re finding too many positive or negative valued players, the issue is somewhere in your selection of who/what replacement level is.
I find it very difficult to explain how to do it in written words, so I created a video that shows a practical strategy you can use to find out who the replacement level players are. Try that out and hopefully you’ll come out with 182 positively valued players.
Tanner
Hi Tanner,
How would you go about combining hitter and pitcher rankings once completed with this? Would you just look at straight up SGP’s against eachother or give some sort of weighting to hitters?
Thanks!
Brendan
Hi Brendan,
This is an interesting question. The short answer is that I don’t believe you can directly compare hitter SGP to pitcher SGP for decision making. The reason being that over time we have found that our ability to predict the top 108 pitchers is not as good (or however many in your league) as our ability to identify the draftable hitters. I’ve written a more in-depth article about this here.
Tanner
I’m confused as to the last thing you mention, about the total SGP supposed to bottom out to zero with the final players expected to be drafted. Why exactly is that important? If SGP stands for Standings Gained Points, doesn’t essentially any player in the league that puts up somewhat decent stats add points in the standings to your team? Why would you ever draft a player that gives you 0 points? I’m in a 10 team league with about 130 players to be drafted with the settings, and I have the 130th player (so essentially the replacement player) at about 8.89 SGP. And it seems like that makes sense since the top player is 18.75.
Hi Matt, consider re-reading the examples with Cano and Heyward at the very top of the whole post above. Or it might help to think about what would happen if you had a team full of 130th players. Even though they have “positive SGPs”, you would be destined to finish in last place. You would not move up the standings by owning a team full of 130th players.
We really only care about the “marginal SGPs” or the “points over replacement” (those are two ways of saying the same thing, in my mind).
So if you take that 130th player’s 8.89 SGPs and then subtract out the replacement level of 8.89 SGPs, that player is worth zero. He’s not going to help you move up the standings. And he’s not negative so you’re not going to fall down the standings by owning him either. Your top player that’s worth 18.75 is going to fall to about 10 marginal (or above replacement) SGPs. You don’t really get 18.75 by owning him, you only get the amount he’s better than the 130th player.
I’d also recommend watching this video as I think I have come up with a better way to document replacement level than what is written above.
Hope that helps explain things more clearly.
Ok, thanks. I think I was doing it completely wrong. I wasn’t subtracting the replacement level off of the actual SGP, I was using the VLookup formulas you had above and it was altering the SGPs but only slightly. The video did help.
Great! No problem. It’s very hard to describe in writing, that’s why I had to go the video route.
Tanner, I intend on buying your $9.88 guide, but I have a draft this morning and no additional time to convert my roto hitters/pitchers into dollar value to compare them. Would a quick and dirty way to do this be multiplying the Pitcher TOTALSPG by .30 and the Hitter TOTALSPG by .7?
Not very precise but seems acceptable.
Carl and I traded e-mails on this and I should have come back and publicly documented what was said so others with the same question can learn from it.
I recommended Carl not take this approach. The big thing this fails to take into account is team and league budget. Those are very important inputs into the value calculation and aren’t included in this proposal. Carl had already figured this out, but just wanted to clear this up for future readers.
This is a terrific tool and I learned a lot more about Excel along the way. I have a (somewhat dumb) question. I am using Steamer projections from FanGraphs and when I went to update my spreadsheet I see two different types of data. One is Steamer Rest of Season and the other is Steamer Updated. Which one should I be looking at? Is the ROS number not updated as much as the Updated info? It says the info was updated 5/1 for both sets of info. What am I missing here?
Hi Mike,
This is a good question. The “Updated” projection is the projected end of season totals for players. So if Player X already has 5 HR, 11 R, and 12 RBI, those will be included in the “Updated” projection.
The “Rest of Season” projection would exclude those statistics that are already accumulated. “RoS” is just “what they project for the remainder of the season”.
One includes what’s already happened. One does not.
I think you want to use “RoS” when evaluating players. You don’t care what they have done. You only care about what they will do going forward. You get no credit for stats that are already earned while on the free agent list or while on someone else’s team.
Tanner
Thanks! Very helpful.
Using this process for the second straight year. It’s awesome, but I generally play in Yahoo! leagues and am always wondering if I could do a better job of finding pitcher value.
For example, in a standard Yahoo! league, you have two SP slots, two RP sots and four P spots. Is it better to due Replacement Level using the top 96 pitchers or should you determine separate Replacement Levels for SPs and RPs? If so, how to you factor players that are eligible at both?
If 24 SP and 24 RP will be drafted (in a 12-team league), there are still 48 P slots to be drafted. It’s impossible to predict whether opponents will draft more SP or RP for those slots so how do you determine where the Replacement Level actually is?
In my estimation, a team should have 4 SP and 4 RP to properly balance enough Ks and W, along with SV and a low ERA and WHIP.
Any thoughts on properly weighting R Level for pitchers in the these leagues?
Hi Carl,
I’d be curious how things work out if you DO NOT distinguish between SP and RP. If you run the calculations with one replacement level (not separate for RP and SP), do you end up with at least 24 RP in the top 96 pitchers?
My guess is that you will.
If that’s the case, then I don’t think distinguishing between SP and RP is needed.
Hope that helps.
Tanner
Here is what I actually wound up doing at it seems to be pretty good:
I figured that we know all the starting closers will be drafted but some RP like Betances, Watson, etc can be more valuable than shaky closers.
So before figuring our SP/RP replacement level, I sorted all pitchers by Total SGP. I filtered out the starters to show only the relievers. I then found the lowest ranked closer, which was Rodney, who was the 35th ranked overall RP. Based on this, I estimated 35 RP to be drafted, which turned out to be the 30 closers plus Betances, Miller, Romo, Strop, Watson and Harris.
As my standard Yahoo! league allows for 96 pitchers, that leaves 61 SP. So I set the replacement level for RP at the 35th RP and the replacement level for SP at the 61st SP.
It definitely passes the eyeball test. When sorting all pitchers, the top RP is 16th overall and certain middle relievers are ranked above some SP. Betances, for example, is just ahead of Wei-Yin Chen and James Shields, which actually makes sense to me. The last pitcher above replacement level is Watson, just behind Ian Kenndey.
That’s an interesting approach.
I’m curious if you tried running things without distinguishing between RP and SP. If so, did any of those RP not make the cut? Did 24 still make it into the draft pool?
Please don’t feel obligated to do any additional work.
While the results of this process look reasonable, I do worry that, to some extent, what you’ve done is to model the rankings to “how things will actually happen in the draft”, but that might not really be showing the “optimal or most accurate value” of the players.
That’s the only thing I’d be worried about. In this situation, it’s probably not a big difference either way. But it’s something to be on the look out for.