Welcome to the first part in a series of posts in which I’ll go through the process I use to create my own fantasy baseball rankings. I’ll provide a link to download the rankings project (in Excel 2010 format) at each part of the series. Please ask questions in the comments below so others can benefit from your questions.
A few notes about the series:
- It was originally written before the 2013 MLB season. The screenshots and player references you see might refer to things from that time frame, but the same approach will work today.
- If you register as an SFBB Insider, you can receive all six parts in a free, tidy, and easy-to-use e-book
- Familiarity with Excel is recommended, but I do my best to explain all formulas and functions used
- Some of the formulas used in the series do not work in Excel for Mac computers. I apologize for this. I don’t understand why Excel isn’t built to operate the same on that platform.
In this first part of the series we’ll set up a new Excel file, download projection data, and do some basic formatting to make the file presentable.
Step-by-Step Instructions
- To start, create and save a new Excel file for this project.

- You could always pay for rankings or projections. But this is a “DIY” project with the goal being to build your own rankings and not spend money in the process. Fangraphs offers a “Projections” section that includes a number of free projection systems for download. Choose your favorite projection system and use the link to “Export Data”.

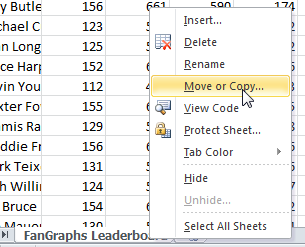
- The data downloads in CSV (comma separated value) format. Locate the downloaded CSV file and open it. It should open in Microsoft Excel. Once the file opens, right-click on the tab and select the option to “Move or Copy…”
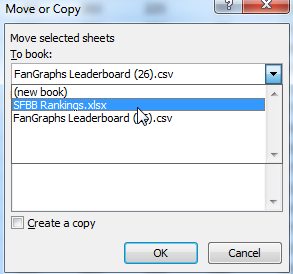
 When prompted, choose your Rankings Excel file (saved in step 1 above) from the drop down menu. Then hit “OK”.

- Any sheet downloaded from Fangraphs has the tab name “FanGraphs Leaderboard”. Right click on the spreadsheet to give it a more meaningful name (like Zips Hitters).

- Hitter and pitcher projection data are stored separately on Fangraphs. Go into the Pitchers section and repeat steps 2 through 4.

- As I write this post, there are currently four projection systems available to download: FANS, ZiPS, Steamer, and Oliver.
 I’m going to download the hitter and pitcher projections from all four systems and pull the data into my rankings spreadsheet by repeating steps 2 through 5 for each projections system, paying careful attention to name each tab in such a way that I can easily identify the source of the data.
- In order to maintain organization (the file is already up to eight tabs), I like to add placeholder worksheets to separate the data. Do this by clicking on the small right-most tab, which is a shortcut to insert a blank worksheet. Click this twice in order to create two new worksheets.
 Right click on one of the newly created worksheet and choose the option to rename. Name the sheet “HITTER PROJECTIONS=>”. Right click on the other worksheet and rename it to “PITCHER PROJECTIONS=>”. Then click and drag on these placeholder tabs to move them.
 Continue dragging and dropping worksheets to get all hitter projections in one section and all pitcher projections in one section.
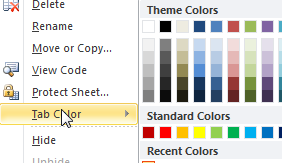
- You’re going to be looking at this spreadsheet for a significant amount of time, so you should spend a minute on the aesthetics. Right click on the tabs and choose the option to add some color to this thing (“Tab Color”).
 If you’re interested, Smart Fantasy Baseball Blue is custom color 17R, 137G, 183B on the RGB scale.
Wrap Up
We’ve now got the basic infrastructure for our rankings. In the next part of the series we’ll discuss player ID numbers, which will lead into using Excel functions and tools to allow us to start pulling data from the projection worksheets.
Do you have any questions? Want to make sure something gets covered in a future part of the series? Please let me know in the comments below.
Make smart choices, everyone.
LINK TO DOWNLOAD fILE: SFBB Rankings – Part 1.xlsx
IF YOU’VE MADE IT THIS FAR…
You might be interested to know that I’ve recently completed parts 7 through 10 of the “Create Your Own Rankings” series. These additional segments include the calculation of dollar values and incorporate calculations for keeper and in-draft inflation. Please click here to read about these additions to the guide and how you can purchase all 10 parts. My hope is that this series is the best step-by-step guide to calculating SGP-based dollar values and inflation is available anywhere.

Please post your questions or suggestions to improve the rankings system in the comments here.