Create Your Own Fantasy Baseball Rankings: Part 6 – Accounting for Replacement Level and Position Scarcity

Welcome to the sixth and final part of the “Create Your Own Fantasy Baseball Rankings” series.  If you missed an earlier part, you can find it here.  You can start at the beginning of the series or if you want to start here at Part 6, you can download the Excel file created during part 5 here.

Please note that this six part series has been adapted into a 10 part book that also shows you how to convert standings gain points into dollar values and how to calculate in-draft inflation.
A few notes about the series:

  • It was originally written before the 2013 MLB season.  The screenshots and player references you see might refer to things from that time frame, but the same approach will work today.
  • If you register as SFBB Insider, you can receive all six parts in a free, tidy, and easy-to-use e-book
  • Familiarity with Excel is recommended, but I do my best to explain all formulas and functions used
  • Some of the formulas used in the series do not work in Excel for Mac computers.  I apologize for this.  I don’t understand why Excel isn’t built to operate the same on that platform.

In this sixth part of the series we will discuss the concept of replacement level players and calculating for position scarcity.

Replacement Level Players

Mike Trout is projected for 114 R, 26 HR, and 83 RBI.  Those numbers are gaudy.  But should he get “credit” for all those statistics if I can go out the day after the draft and pickup a player on the free agent list that is projected for 50 R, 15 HR, and 55 RBI?

This is the concept of replacement level.  If player X is projected for 26 HR and there are several free agents that will hit 15 HR, the true value of player X is in his 11 additional HR (26 – 15).

So when calculating a player’s SGP, you should not perform the calculation on the “gross” or total number of HRs.  Rather, you should calculate SGP with the amount of HR over a replacement level player (a free agent).

Determining Replacement Level

Assuming a 12-team league with 14 hitters (two C, 1B, 2B, SS, MI, 3B, CI, five OF, DH), 168 offensive players will be drafted (you can add more to adjust for bench players).  So the 169th player is “replacement level”, right?

Arguably this is true.  But let’s fine tune this a little more.  In a 12-team league where each team must start two catchers, the 25th best catcher is the “replacement level catcher”.

If the league request one 2B, one SS, and one Middle Infielder, then 36 combined 2B and SS will be drafted.  We can assume this will be comprised of 18 2B and 18 SS, and the 19th best of each position will be the “replacement level”.

Likewise, you might expect 18 1B, 18 3B, and 60 OFs to be drafted.  But given that these positions typically produce better offensive statistics than 2B and SS, 1B and OF tend to be slotted into the UTIL/DH spots.  This can push the 1B up to 24 selected players and the OF up to 66 selected players (with the 25th 1B being “replacement level” and the 67th OF being “replacement level”.  

Let’s look at some projected statistics for Jason Heyward and Robinson Cano (please note the tables below don’t foot due to rounding) :

Category Heyward Cano
R SGP 3.82 3.58
HR SGP 2.60 2.40
RBI SGP 3.62 3.98
SB SGP 1.38 0.32
AVG SGP 0.12 0.96
TTL SGP 11.54 11.25

On the surface, the two are near equals, with Heyward holding a slight overall edge in SGP.  But let’s now compare each to a replacement level player at their position.  In my rankings spreadsheet, the 61st ranked OF is Ryan Ludwick.

Category Heyward Ludwick Heyward over Ludwick
R SGP 3.82 2.32  1.50
HR SGP 2.60 1.92  0.68
RBI SGP 3.62 2.72  0.90
SB SGP 1.38 0.11  1.27
AVG SGP 0.12 -0.14  0.26
TTL SGP 11.54 6.93  4.61

In my rankings spreadsheet, the 19th best 2B is Gordon Beckham.

Category Cano Beckham Cano over Beckham
R SGP 3.58 2.20  1.38
HR SGP 2.40 1.25  1.15
RBI SGP 3.98 2.07  1.91
SB SGP 0.32 0.53  -0.21
AVG SGP 0.96 -0.35  1.31
TTL SGP 11.25 5.67  5.54

So despite a higher gross SGP (11.54 vs. 11.25), Heyward comes out as less valuable when we adjust for replacement level players.  In fact, Cano moves to nearly one whole SGP of an advantage over Heyward (5.54 vs. 4.61). Continue reading “Create Your Own Fantasy Baseball Rankings: Part 6 – Accounting for Replacement Level and Position Scarcity”
Create Your Own Fantasy Baseball Rankings: Part 5 – Understanding Standings Gain Points

Welcome to the fifth part of the “Create Your Own Fantasy Baseball Rankings” series.  If you missed an earlier part, you can find it here.  You can start at the beginning of the series or if you want to start here at Part 5, you can download the Excel file created during part 4 here.

Please note that this six part series has been adapted into a 10 part book that also shows you how to convert standings gain points into dollar values and how to calculate in-draft inflation.

A few notes about the series:

  • It was originally written before the 2013 MLB season.  The screenshots and player references you see might refer to things from that time frame, but the same approach will work today.
  • If you register as SFBB Insider, you can receive all six parts in a free, tidy, and easy-to-use e-book
  • Familiarity with Excel is recommended, but I do my best to explain all formulas and functions used
  • Some of the formulas used in the series do not work in Excel for Mac computers.  I apologize for this.  I don’t understand why Excel isn’t built to operate the same on that platform.

In this fifth part of the series we will discuss the concept of Standings Gain Points (SGP), a method of evaluating and ranking players.  At the end of this part, we’ll actually have some primitive rankings in place.  But we have quite a few concepts to go over before we  jump into Excel.

THE DIFFICULTY IN RANKING PLAYERS

Which player is worth more and should be ranked higher?

  • Player A – .280, 65R, 30HR, 95RBI, 0SB
  • Player B – .265, 100R, 10HR, 55RBI, 40SB

Or how about this?

  • Player A – .280, 65R, 30HR, 95RBI, 0SB
  • Player C – 5W, 40SV, 75SO, 2.50ERA, 1.10 WHIP

How do you rank different types of players (speed/average vs. power/RBI)?  Or even worse, how do you evaluate the worth of a hitter against the worth of a pitcher?  Enter the concept of Standings Gain Points.

STANDINGS GAIN POINTS – MY INTERPRETATION

The end goal of rotisserie fantasy baseball is to accumulate the most points in the standings.  The Standings Gain Points approach to valuing players is to convert a player’s statistics into the number of rotisserie points those statistics are worth.  

Let’s use some example statistics from a real 12-team 5×5 rotisserie league to illustrate:

POS HR RBI W ERA
1 291 1,054 108 3.359
2 287 1,027 107 3.365
3 281 1,017 93 3.477
4 274 1,003 92 3.678
5 272 998 88 3.815
6 267 973 88 3.857
7 263 968 84 3.946
8 261 965 82 4.096
9 244 945 82 4.097
10 239 921 81 4.177
11 234 920 81 4.284
12 191 792 78 4.361

Continue reading “Create Your Own Fantasy Baseball Rankings: Part 5 – Understanding Standings Gain Points”

Create Your Own Fantasy Baseball Rankings: Part 4 – Pitcher Rankings

Welcome to the fourth part of the “Create Your Own Fantasy Baseball Rankings” series.  If you missed an earlier part, you can find it here.  You can start at almost any part of the series, but it’s not recommended you start with Part 4 unless you are very familiar with the Excel functions listed below.  Part 4 is essentially reperforming step 3(which focused on hitters) for pitchers.  This post assumes you are familiar with the Excel functions and formulas used in Part 3.

Please note that this six part series has been adapted into a 10 part book that also shows you how to convert standings gain points into dollar values and how to calculate in-draft inflation.

A few notes about the series:

  • It was originally written before the 2013 MLB season.  The screenshots and player references you see might refer to things from that time frame, but the same approach will work today.
  • If you register as SFBB Insider, you can receive all six parts in a free, tidy, and easy-to-use e-book
  • Familiarity with Excel is recommended, but I do my best to explain all formulas and functions used
  • Some of the formulas used in the series do not work in Excel for Mac computers.  I apologize for this.  I don’t understand why Excel isn’t built to operate the same on that platform.

In this fourth part of the series we will use Excel formulas and functions to start pulling pitcher information (name, position, team) and projection information in order to eventually calculate our own rankings.

EXCEL FUNCTIONS AND FORMULAS IN THIS POST

Below are the Excel functions and formulas used in this post.  If you would like more background on them, please refer to Part 3 or ask questions in the comments area below.

  • VLOOKUP
  • TABLES and NAMED RANGES
  • COLUMN

STEP-BY-STEP INSTRUCTIONS

  1. Staying consistent with the hitting projections, I’m going to use the free Steamer projections from Fangraphs.
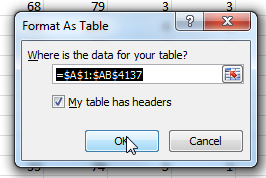
  2. To make the pitching projections easier to work with, convert the “Steamer Pitchers” tab to a “table” in Excel.  To do this, click anywhere within the data on the “Steamer Pitchers” worksheet.  Then locate the “Home” tab in the Excel menu system (“the ribbon”).  Click once on the “Format as Table” drop down, and then select your desired color scheme.Part 3-2You will then be prompted to verify the range of cells in the table and that your table has a header row (e.g. Name, W, L, ERA, etc.).  Check “My table has headers”.  Click OK.Part 3-3
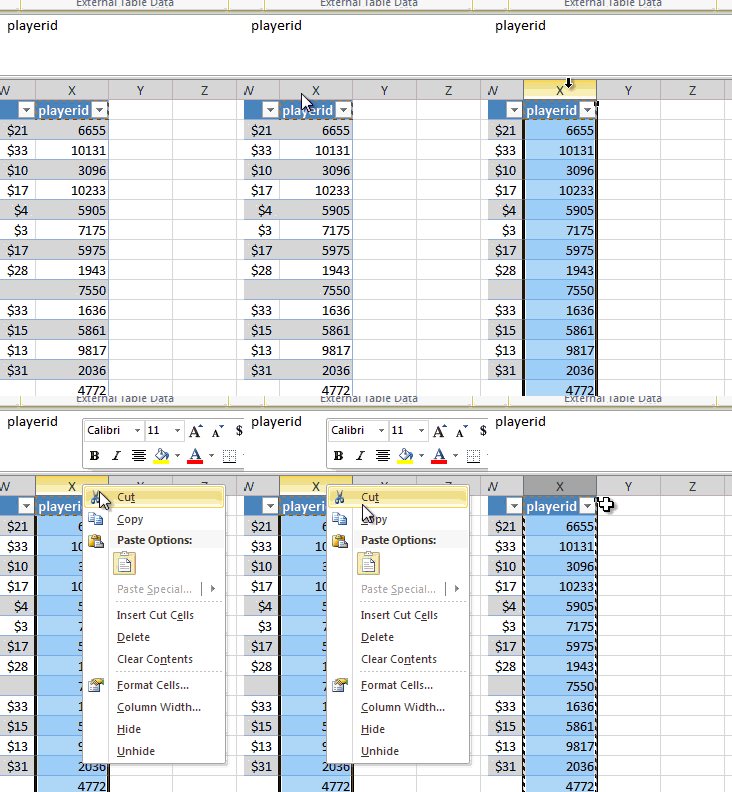
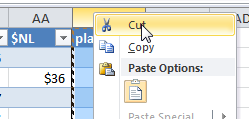
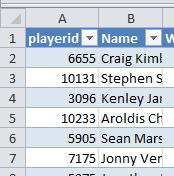
  3. Because we’ll later be these pitcher projections into other worksheets, it will help us greatly if the fangraphs player ID is the first column of the table (you can use the VLOOKUP formula if the player ID is in the first column, otherwise you’re stuck using more difficult and/or multiple formulas).  Right-click on the top of the fangraphs player ID column (should be column X in the Steamer Pitchers projections).Cut_Pitcher_IDsPart 3-4.1Now right-click on the top of the player name column (column header “A”) and select “Insert Cut Cells”.  When you’re done, you should have the “playerid” column first and “Name” second.Part 4-1 Continue reading “Create Your Own Fantasy Baseball Rankings: Part 4 – Pitcher Rankings”

Create Your Own Fantasy Baseball Rankings: Part 3 – VLOOKUP, Excel Tables, Named Ranges

Welcome to the third part of the “Create Your Own Fantasy Baseball Rankings” series.  If you missed an earlier part, you can find it here.  You can start at the beginning of the series or if you want to start here at Part 3, you can download the Excel file created during part 2 here.

Please note that this six part series has been adapted into a 10 part book that also shows you how to convert standings gain points into dollar values and how to calculate in-draft inflation.

A few notes about the series:

  • It was originally written before the 2013 MLB season.  The screenshots and player references you see might refer to things from that time frame, but the same approach will work today.
  • If you register as SFBB Insider, you can receive all six parts in a free, tidy, and easy-to-use e-book
  • Familiarity with Excel is recommended, but I do my best to explain all formulas and functions used
  • Some of the formulas used in the series do not work in Excel for Mac computers.  I apologize for this.  I don’t understand why Excel isn’t built to operate the same on that platform.

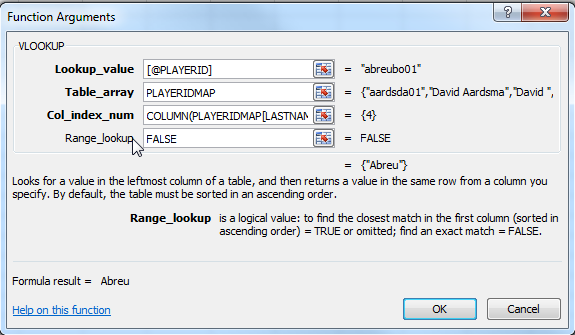
In this third part of the series we will use Excel formulas and functions to start pulling player information (name, position, team) and projection information in order to eventually calculate our own rankings.  Strap in…  This is a long one.

Excel Functions and Formulas In This Post

Below are the Excel functions and formulas used in this part of the series.  If you’re already familiar with what these are, you can skip ahead. Continue reading “Create Your Own Fantasy Baseball Rankings: Part 3 – VLOOKUP, Excel Tables, Named Ranges”

Create Your Own Fantasy Baseball Rankings: Part 2 – Understanding Player IDs

Welcome to the second part of the “Create Your Own Fantasy Baseball Rankings” series.  If you missed Part 1, you can find it here.  You can start at the beginning or if you want to start here at Part 2, you can download the Excel file created during part 1 here.

A few notes about the series:

  • It was originally written before the 2013 MLB season.  The screenshots and player references you see might refer to things from that time frame, but the same approach will work today.
  • If you register as SFBB Insider, you can receive all six parts in a free, tidy, and easy-to-use e-book
  • Familiarity with Excel is recommended, but I do my best to explain all formulas and functions used
  • Some of the formulas used in the series do not work in Excel for Mac computers.  I apologize for this.  I don’t understand why Excel isn’t built to operate the same on that platform.

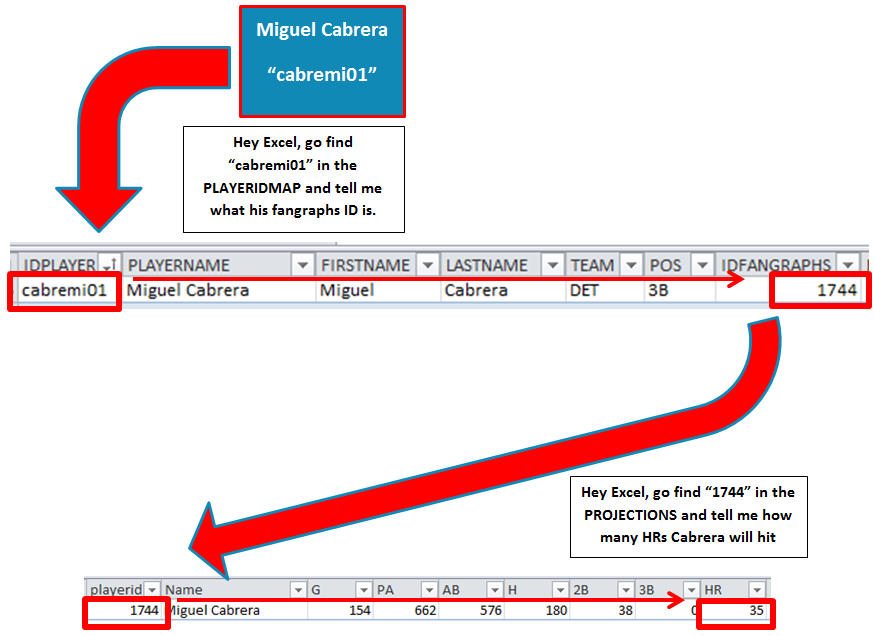
In this second part of the series we discuss what player IDs are so we can later use them to pull information within Excel.  You might have noticed the projection data downloaded from fangraphs in part 1 did not contain the player’s team or position.  But the downloads did contain each player’s fangraphs ID.

UNDERSTANDING PLAYER IDs

Are you familiar with Chris Young, the long-time Arizona Diamondback outfielder with a career batting average of about .240?  Are you familiar with Chris Young, the oft-injured extremely tall pitcher with a career ERA of 3.79?

Even if you’re not familiar with them, know that there are two baseball players of recent note named Chris Young.  Look at this chart:

Source .240 Hitting ID Tall Injured ID
Name Chris B. Young Chris R. Young
Baseball Reference youngch04 youngch03
Fangraphs 3882 3196
MLB 455759 432934
CBS 4898811 517762

Just like you have a unique Social Security Number or Employee ID associated with your name, baseball players have been given unique IDs from different organizations/websites.  These IDs give us a way to differentiate Chris B. Young from Chris R. Young.  The problem is that there is not an agreed upon ID for each player.  Each website or fantasy service uses their own ID.

We need a tool to translate the different player IDs from the various baseball services.  That’s where the Smart Fantasy Baseball Player ID Map comes in. Continue reading “Create Your Own Fantasy Baseball Rankings: Part 2 – Understanding Player IDs”

Create Your Own Fantasy Baseball Rankings: Part 1 – Download Free Projection Data

Welcome to the first part in a series of posts in which I’ll go through the process I use to create my own fantasy baseball rankings.  I’ll provide a link to download the rankings project (in Excel 2010 format) at each part of the series.  Please ask questions in the comments below so others can benefit from your questions.

A few notes about the series:

  • It was originally written before the 2013 MLB season.  The screenshots and player references you see might refer to things from that time frame, but the same approach will work today.
  • If you register as an SFBB Insider, you can receive all six parts in a free, tidy, and easy-to-use e-book
  • Familiarity with Excel is recommended, but I do my best to explain all formulas and functions used
  • Some of the formulas used in the series do not work in Excel for Mac computers.  I apologize for this.  I don’t understand why Excel isn’t built to operate the same on that platform.

In this first part of the series we’ll set up a new Excel file, download projection data, and do some basic formatting to make the file presentable.

Step-by-Step Instructions

  1. To start, create and save a new Excel file for this project.
    Rankings Part 1-1
  2. You could always pay for rankings or projections.  But this is a “DIY” project with the goal being to build your own rankings and not spend money in the process.  Fangraphs offers a “Projections” section that includes a number of free projection systems for download.  Choose your favorite projection system and use the link to “Export Data”.Fangraphs-RoS-Export
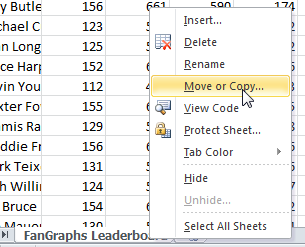
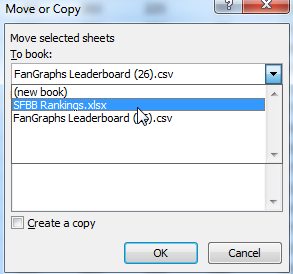
  3. The data downloads in CSV (comma separated value) format.  Locate the downloaded CSV file and open it.  It should open in Microsoft Excel.  Once the file opens, right-click on the tab and select the option to “Move or Copy…”
    Rankings Part 1-3When prompted, choose your Rankings Excel file (saved in step 1 above) from the drop down menu.  Then hit “OK”.
    Rankings Part 1-4
  4. Any sheet downloaded from Fangraphs has the tab name “FanGraphs Leaderboard”.  Right click on the spreadsheet to give it a more meaningful name (like Zips Hitters). Continue reading “Create Your Own Fantasy Baseball Rankings: Part 1 – Download Free Projection Data”