Defense Independent Pitching Statistics (DIPS)
“There is little if any difference among major-league pitchers in their ability to prevent hits on balls hit in the field of play.” – Voros McCracken, Pitching and Defense
McCracken’s article mentioned above was extremely influential in pioneering a new wave of baseball statistics. McCracken began the process of separating pitching statistics from the defensive players behind the pitcher. The question being, “Can we measure the effectiveness of a pitcher by using statistics that only a pitcher can control?”.
In attempting to answer this question, McCracken created Defense Independent Pitching Statistics, or “DIPS”. A key finding in McCracken’s work is that a pitcher’s walk rate, strikeout rate, and home run rates were somewhat consistent from year-to-year, while BABIP was not.
If a player can consistently maintain walk rates, strikeout rates, and home run rates, any fluctuation in statistics like ERA or BABIP must be influenced by defense and luck, which are factors outside a pitcher’s control.
With this in mind, let’s examine the five possible outcomes for a given pitcher vs. batter plate appearance:
- Ball hit into play for a hit
- Ball hit into play for an out
- Home run
- Strike out
- Walk (or HBP)
Of these categories, items one and two are clearly dependent upon defensive players and luck (is the frozen rope hit directly at the third basemen or six inches out of his reach?). Items three, four and five are completely independent of defensive players. And while some luck is involved in home run rate, the pitcher’s skill is a factor as well (some pitchers give up a lot of home runs, some can prevent them).
That’s where FIP comes in. No not that FIP. This one.
Fielding Independent Pitching (FIP)
FIP, developed by Tom Tango, attempts to evaluate pitchers only on factors under their control. Or independent of fielding. Tango’s calculation uses the measures that are significantly within a pitcher’s control (HR, BB, K) to approximate what the pitcher’s ERA “should” be. FIP is an easy stat to use and calculate because it has a simple calculation:
FIP = (13 * HR + 3 * BB – 2 * K) / IP + 3.20
The addition of 3.20 is to more closely align FIP with ERA. Otherwise you end up with numbers like 0.50 or 0.77.
FIP turns out to be an incredible predictor of ERA (check out this analysis of the top 10 ERA and FIP leaders since 1962 by Tom Tango).
Is FIP Always an Accurate Measure of ERA?
No. In an individual season, ERA and FIP can differ significantly (up to 1.00). Further, some pitchers display a perpetual difference between ERA and FIP. For example, Zack Greinke has a career ERA of 3.77 and a career FIP of 3.45 (his actual results are worse than expected). While Mark Buehrle has a career ERA of 3.82 and a career FIP of 4.14 (better than expected).
A significant difference between ERA and FIP over the course of a lengthy career suggests other factors at play that FIP does not account for. Perhaps there is some intangible quality that Grienke does not possess that leads him to have an ERA greater than his FIP. Maybe Mark Buehrle has this quality and it allows him to regularly outperform his FIP projections.
How Do I Apply FIP to Fantasy Baseball?
Granted, this Harball Times article is from 2005. But the results are impressive. Of the 22 pitchers whose ERA exceeded their FIP the most, 18 saw their ERA decline the next year (and two didn’t even play!). Of the 30 whose ERA was lower than FIP, 23 saw their actual ERA increase. Applying this, we can look for pitchers whose FIP varied greatly from actual ERA to identify candidates likely to improve upon last year’s ERA or to identify those likely due for an increase in ERA.
What Do You Think?
Please leave your comments below. Have you added FIP to your repertoire yet?
Thanks for reading.
FURTHER READING
Tom Tango, the creator of FIP, is also well known for The Book: Playing the Percentages in Baseball. This is recommended reading if you’re looking to understand optimal baseball strategy.
RESOURCES

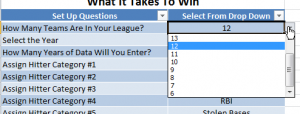

 After you’ve completed all the data entry into the yellow tabs, return to the “Results” tab to see the stats necessary to win your league.
